|
Other Links:
Outside links in this document open in
new windows.
|
Outline
- 0) Introduction
- 1) Geometry
- 2) Spectroscopic method
- 3) Standard candles and cosmological
distances
- a) Cepheids
- b) Supernovae
- 4) The cosmological red shift
- 5) Standard objections by creationists
- 6) Summary
- References
- Acknowledgements
0) Introduction
a) Purpose of this FAQ
An often-used argument for the universe being much older than proposed by young earth creationists (YEC) is the fact that we can see astronomical objects which are billions of light years away (a light year is the distance which light travels in one year, approximately 9.5 × 10¹² kilometers). Obviously (well, perhaps not so obvious - see section 5), the light from these objects needed billions of years to reach us, and therefore the universe has to be billions of years old.
But many people don't know how the distances to astronomical objects can be measured and think there may be something wrong with the methods of the scientists, that perhaps all objects we see in the sky are no farther away than some thousand light years, and hence the YECs could be right anyway.
Therefore, in this FAQ, I will try to explain the methods which are used in astronomy, and try to answer some of the standard objections raised by YECs. I will concentrate on the best-known and most used methods; more information can be found e.g. at Stellar Astronomy and The ABC's of Distances.
b) General outline
For measuring distances to astronomical objects, one uses a kind of "ladder" of different methods; each method goes only to a limited distance, and each method which goes to a larger distance builds (in general, but not always) on the data of the method(s) before. The starting point is knowing the distance from the earth to our sun; this distance is called one astronomical unit (AU) and is roughly 150 million kilometers. I think that even YECs agree on this number, hence I don't discuss here where one gets it from. (Need I mention that one has to accept the heliocentric model, too?)
The next step in the ladder consists of simple geometrical methods; with them, one can go to a few hundred light years (but similar methods can be used on larger scales). This is covered in section 1.
Using data acquired by these geometrical methods, and adding photometry and spectroscopy, one gets the next step in the ladder. The main tool in these spectroscopic methods is the so-called "Hertzsprung-Russell-diagram"; this will be explained in section 2.
For even larger distances in the cosmos, one needs one additional element: so-called "standard candles". What they are, and how they are used, will be told in section 3.
In section 4 I'll explain the cosmological red shift and the Hubble relation, which are used for really large distances (several hundreds of millions of light years or even several billions of light years).
Section 5 deals with some standard objections by YECs; I provide references which refute them.
Finally, in section 6 I give a short summary.
1) Geometry
a) Introduction
The distance to nearby stars can be determined by their so-called parallaxes.
To see what this is, hold a finger upwards in front of your nose, a few centimeters away, and look at it first only with the left eye closed, and then with the right eye closed. If you compare its position with some background objects, you will notice that apparently the finger moves when you switch from one eye to the other! The explanation is obvious: your eyes aren't in the same place, and hence they have a different line of sight to the finger, they have to look at a different angle in order to see the finger.
The angles at which your eyes have to look obviously depend on the distance of the finger to your nose. What is more important: the difference in the angles depends on the distance; it gets smaller when the distance gets greater. Therefore the difference in angles can be used to measure the distance (if one knows the relationship between these two things, which is simple trigonometry). And exactly this difference in angles is called the parallax. The distance between your eyes is called the baseline; the bigger the baseline is, the bigger the parallax is, for the same distance of the observed object to the baseline.
The stars are very distant from us; their parallax is so small that the short baseline from one eye to another is obviously much too small. But we have a rather big baseline available for measuring distances to stars: the diameter of the orbit of the earth. Simply look where (at which angle) a star is in summer in the sky, and then look again where (at which angle) the same star is in winter in the sky, determine the difference in angles, and you have the parallax for this star - and knowing this and the length of your baseline (2 AU = 300 million kilometers), you can compute the distance to the star. The following picture should illustrate this:
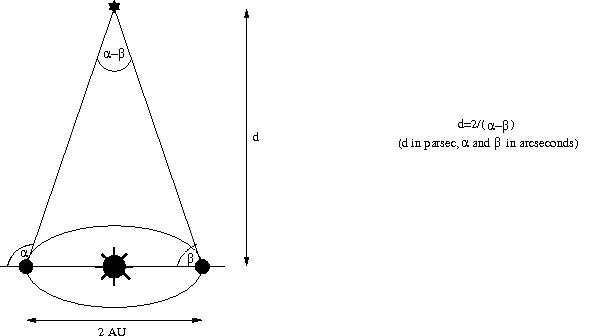
One word that one often encounters in this context is the parsec (short for "parallax second"); this is the distance of a star that would have a parallax of two arcseconds, or, equivalently, the distance from our sun at which the angle between earth and sun (1 AU) would be one arcsecond (one arcsecond is the 60th part of one arcminute, and one arcminute is the 60th part of one degree). This unit is useful because for large distances (small parallaxes), distance is inversely proportional to the parallax; hence a star with a parallax of x arcseconds is 2/x parsec away. As you can calculate yourself, one parsec is approximately 206,000 AU, or 3.09 × 10¹³ kilometers, or 3.26 light years.
Unfortunately, there is one further possible point for confusion: in astronomy, "parallax" usually means the so-called annual parallax, which is the difference in the angles of a star seen from the earth and from the sun, not the difference in the angles of a star seen from the earth in summer and winter. This annual parallax (let's call it p) is just half of the parallax x introduced above, and therefore the distance of a star (in parsec) is given then just by 1/p (where p is measured in arcseconds).
In order to get some feeling for this method, you might try to play around at the Parallax Lab.
b) Measurements
All stars in our neighbourhood are farther away than one parsec; and hence their parallaxes are smaller than one arcsecond. In order to measure such small angles, instruments with great precision are needed.
The first one who was able to measure a parallax of a
star
(61 Cygni)
was the astronomer and mathematician
Wilhelm Bessel in 1838, at the Observatory at
Königsberg. He obtained the value 0.314 arcseconds
(the modern value is 0.292 arcseconds, and both are
annual parallaxes), which gives a distance of a bit
over 10 light years.
It should be noted here that already with the precision available back then, which allowed one only to measure distances up to around 10 light years, it was possible to show that most of the stars should be much farther away: by measuring the distances of as many as possible nearby stars, one can get a value for the average density of stars (the average amount of stars per cubic light year), and then simple counting of the visible stars and dividing this by the average density gives a (lower) bound on the size of the universe! Obviously this assumes that the density of stars is more or less the same in all regions where we can see stars, but just comparing the angular distances of the star in the sky, it is clear that this assumption seems to be justified. But even if one would use a far higher density of stars, this still would imply a very large universe, because of the very large number of stars which can be seen with telescopes.
In the decades since Bessel's measurements, the precision of measurements has increased greatly, but there was always the problem of the atmosphere of the earth, which causes errors in the position measurements (for example, because of density fluctuations which blur the images). Because of this, in 1989 the satellite HIPPARCOS was launched. It measured the positions, parallaxes and other parameters of close to 120,000 nearby stars. The achieved mean precision in measuring the parallaxes was 0.97 milliarcseconds (one milliarcsecond is one thousandth of an arcsecond). In the HIPPARCOS catalogue, which was compiled from the measured data, you can find thousands of stars with parallaxes of less than 2 milliarcseconds - which means they are more then 500 parsec (1,630 light years) away.
Another satellite, named GAIA, will be launched in 2010. It will be able to measure even more distant stars, up to 10 kiloparsec (10,000 parsecs or 32,600 light years).
If one uses radio waves instead of visible light, one can measure even smaller parallaxes, even down on earth, without the need for satellites. The method used there is called Very Long Baseline Interferometry: two radio telescopes with a large distance between them (usually on different sides of the earth) are coupled together in a way which improves the measurement of angles greatly, the precision is on the order of 100 microarcseconds (one microarcsecond is one millionth of one arcsecond). With this method, distances to pulsars (stars consisting mainly of neutrons which emit radio pulses regularly) were measured (Brisken et al. 2002); the biggest distance found there was about 2,300 parsec (8,000 light years). This alone shows already that the universe is older than 6,000 years.
c) Other geometrical methods
Similar geometrical methods can be used for objects which are even billions of light years away (for example, galaxies and quasars). In these cases, one has to know the size of an object, then one measures the angles at which one sees the two sides of the object, and from the difference between the angles, one gets the distance. The "only" remaining problem is to know the size of the object.
One method to get the size is to identify the type of object (star, galaxy, dust disc or cloud, and so on), measure as many as possible of its parameters (luminosity, mass, angular distance to other objects, and so on), based on these data, try to model it, and extract the size from the model. This method was used for determining the distance to the galaxy NGC 4258 (Herrnstein et al. 1999). The objects modeled and observed in this case are clouds of water orbiting the nucleus of this galaxy which emit characteristic microwave radiation. Observation shows that the frequency of this radiation changes periodically with time (because of the Doppler effect: a shift in the wavelengths of the emitted light which is proportional to the speed with which they move). The thereby observed dependence of the velocities on time allows one to the exact orbits then, including the distance of the water clouds to the center of their orbit and therefore the absolute size of the observed object. The result was that NGC 4258 is about 7.2 million parsecs (about 23.5 million light years) away from us, with an uncertainty of only around 5%.
With somewhat similar methods, the distance to the center of our own galaxy was determined: the orbit of a single star orbiting the central black hole of our galaxy was modeled using several great precision measurements. This calculation yielded the distance to the galactic center - 8 kiloparsec (approximately 26,000 light years), in excellent agreement with other determinations of this distance (Eisenhauer 2003).
Another method is using the speed of light. A nice example here is the supernova explosion SN1987A which happened 1987 in the Large Magellanic Cloud, the second-nearest galaxy to our own galaxy, the Milky Way (for more information on supernovae, see section 3b and links therein). Before the explosion, the star was already surrounded by a ring of dust. This ring began to glow about a year after the supernova explosion, when the light from the explosion reached it. Hence we know that the diameter of the ring is about two light years, and by measuring its angular diameter in the sky, the distance to the supernova was determined to be approximately 169,000 light years. This agrees well with other distance determinations to the Large Magellanic Cloud (Panagia et al. 1991; for a more detailed explanation, see also Greene's Creationism Truth Filter).
Yet another method is measuring the motion of parts of the object (how fast the angles to these parts change) and comparing this to the speeds measured by the Doppler effect. This method was used to determine the distance to the quasar 3C 279 (Homan 2000)"; it turned out to be between 1.5 and 2.3 Gigaparsec away. A gigaparsec is a billion parsecs so that distance corresponds to approximately 6 billion light years. The problem with this method is that one needs to know additional parameters, for example the angle of the movement to the line of sight, in order to get a meaningful answer.
2) Spectroscopic
method
a) Stellar photometry and spectroscopy
For stars so far away that their parallaxes are not measurable (yet), mainly photometry is used, that is, measurements of their brightnesses. We know from physics that brightness decreases proportional to the square of the distance (double the distance of an object, and its brightness will go to one quarter); this connection between brightness and distance is known as the inverse-square-law. It has to be changed slightly if one takes General Relativity and the expansion of the universe into account, but these changes are irrelevant for all stars in our galaxy and in other nearby galaxies.
Using this law, if we know the brightness of a star in a fixed reference distance, and compare this to the measured brightness, we can say how far away the star is. The standard reference distance used in astronomy is 10 parsec; the brightness a star would have in this distance from us is called the absolute brightness of the star. Its actual brightness, which we can observe on earth, is called the apparent brightness.
Hence the only remaining problem is: How can we know the absolute brightness of a star without knowing its actual distance beforehand? The solution of this problem comes from spectroscopy and an analysis of the spectra of the nearby stars for which we know the distances from their parallaxes.
If one looks at the spectrum of a star (splits the light received from it and looks at each wavelength (each color) separately, for example, by using a prism), one sees dark lines at some wavelengths (some colors) - there is much less light emitted at these wavelengths than at the others. The standard explanation for this is that the atoms in the atmosphere of the star absorb some of the light which is emitted, and each element absorbs only some distinct, characteristic wavelengths of light. If the atoms are excited, they emit these same wavelengths, hence one can determine precisely which spectral lines belong to which element. These are well-known phenomena, studied by Bunsen and Kirchhoff already in the 19th century. Some nice pictures of emission lines of the elements and further explanation can be found at Spectra of Gas Discharges.
Hence by looking at the dark lines in the star spectra, we can determine which elements are in its atmosphere. The crucial point now is that all stars can be put into groups, so-called spectral classes, where each class has a distinct pattern of dark lines in the spectra, hence a distinct abundance of elements in its atmosphere. These spectral classes are labeled with capital letters: O, B, A, F, G, K, M (and others; a good way to keep these in mind is the phrase "Oh, be a fine girl/guy, kiss me"). At Spectral Sequence of Stars some examples for star spectra for each class can be found.
If one examines the stars in the classes further, one sees that each spectral class is associated with a certain color of the stars, and we know from the theory of radiation that the color depends on the surface temperature of the star (this is not only true for stars, but in everyday life, too: if one heats up iron, for example, it first glows red, then yellow, and heating it up even further, it glows white). The temperature is highest for stars in the spectral class O and decreases until the class M; our own sun, which is in class G, has a surface temperature of 5,780 Kelvin (this corresponds to approximately 5510 degrees Celsius or 9950 degrees Fahrenheit). The color is white in class O and goes over blue and green to yellow (class G, our sun) and then on to orange and finally red (class M).
b) The Hertzsprung-Russell diagram
After all of these introductory words, now comes the interesting part: if one plots the stars for which we know the distance from their parallaxes, and hence for which we know the absolute brightness in a diagram, where one axis is spectral class/color/temperature, and the other is absolute brightness, one gets (mainly) a fairly narrow line! Hence spectral class/color/temperature and absolute brightness are strongly related to each other, and if one knows the spectral class/color/temperature, one can easily determine the absolute brightness.
Such a diagram is called a Hertzsprung-Russell diagram, after the two astronomers who invented it (independently, the first in 1911, the second in 1913). The line on which most of the stars lie is called the main sequence. An example of such a diagram, which was constructed using data from the above mentioned HIPPARCOS satellite, can be found at this page about The Hertzsprung-Russell Diagram; a lot more diagrams are available in the following Postscript file: Statistical Properties: Astrophysical Relationships. More precisely, what you will find there are so-called two-color-plots: the brightness of a star is measured at two different wavelengths, and what is plotted is the difference of these two brightnesses on the X axis and one of the two brightnesses on the Y axis. But the theory of radiation tells us that the difference of the two brightnesses is closely related to the surface temperature of a star, and hence these diagrams are essentially identical to Hertzsprung-Russell diagrams.
The theory of stellar development even predicts that if one plots surface temperature against absolute brightness, one should get a line (and not a random distribution of the stars); the laws of physics ensure that there is a close correlation between surface temperature and absolute brightness: the absolute brightness depends on how much energy is produced in the star, this depends on the mass of the star (and what nuclear reactions go on inside it), the mass determines its volume, the volume determines its surface, and the surface, combined with the absolute brightness, determines the temperature. Hence for stars which have the same nuclear reactions in their core, absolute brightness determines surface temperature uniquely, and vice versa.
But there are lots of stars which don't lie on the main sequence, too; if they lie above the main sequence, they are called giants, if they lie below it, they are called dwarfs. This is because the theory of radiation tells us that if two stars have the same temperature, but one is brighter than the other, the brighter one must have a larger surface - it is bigger. According to the things said above, this has to mean that different nuclear reactions are going on inside it, and indeed the theory of stellar development (or stellar evolution, as it is often called - causing confusion among creationists...) predicts that stars with different nuclear reactions in their cores should exist.
In order to explain the main sequence, the giants and the dwarfs, one would have to explain the whole theory of stellar development; this is too much for including it here. The essence is that the stars are on the main sequence during most of their life time and "burn" hydrogen in this time ("burning" is an often used word here; in reality it's not a chemical reaction, but a nuclear reaction: hydrogen nuclei are fused to helium nuclei). Then they become giants, "burning" helium and other elements, and in the end they shrink to dwarfs, "burning" nothing at all, but simply cooling (or, if they are bigger, they blow up in giant explosions at the end of their life time - these are the supernovae). You can find more information in the article Stellar Evolution & Death, for example.
The theory of stellar development also predicts that hotter stars (which lie on the upper left of the main sequence) should live much shorter than cooler stars (which lie on the lower right). Hence by looking at the H-R diagram of a stellar cluster (a group of stars which are close together, came into existence at the same time and therefore all have the same age) and determining which stars still lie on the main sequence and which already wandered off and became giants, one can determine the age of the cluster. At some place in the upper left, the main sequence no longer exists, but the stars lie on another line which leads from there to the upper right. This kink in the diagram is often called "knee", and the position of this knee tells us how old the cluster is. The theory of stellar development tells us that such kink should appear as well as which age this implies for the clusters. The ages which can be derived in this way are of no comfort to the creationists: stellar clusters usually are billions of years old (more details on this can be found e.g. at the page Hertzsprung Russell Diagram And Stellar Evolution).
c) Determining distances using the H-R Diagram
What has all of this to do with determining distances? Simple: observe the stars in a stellar cluster (the stars in such clusters are all approximately at the same distance from us), measure their surface temperatures and brightnesses, and draw a Hertzsprung-Russell diagram with these measurements. You will get again a main sequence, some giants and some dwarfs - but this time, you don't have plotted their absolute brightnesses, but their apparent brightnesses. By comparing this new diagram to the Hertzsprung-Russell diagram for the nearby stars, you will see that the ratio of the observed apparent brightness to the absolute brightness is the same for every kind of star - and this ratio gives you then the distance to the cluster.
Essentially, the Hertzsprung-Russell diagram gives us the information we missed: the absolute brightnesses of the stars for which we can only observe their apparent brightnesses. There are some assumptions we have to make - for example, that the elements have the same spectral lines "out there", that stellar development works as predicted by our theories, and so on, but in the end it is simply the same assumption used everywhere in science: that the laws of nature work in the same way everywhere in the universe. And the fact that every observation of a cluster so far yielded a main sequence, some giants and some dwarfs, in exactly the proportions which were predicted by the theory of stellar development, gives strong support that this assumption is valid.
3) Standard candles and cosmological distances
When one determines the distance of an object like a cluster or a galaxy using the H-R Diagram, one has to measure the brightnesses of lots of stars, including faint ones, in order to get a reliable diagram. Unfortunately, faint stars can't be seen if the observed object is too far away (because of the inverse-square law), hence one has to resort to other methods: one uses bright objects for which the absolute brightness is known. By measuring the apparent brightness and comparing it to the absolute brightness, one again gets the distance.
The only remaining problem is that one has to know the absolute brightness of the observed object. Fortunately, several types of objects exist for which one can determine their absolute brightnesses without knowing their distances. Such objects are called standard candles; I'll discuss the two most common in the next two subsections.
a) Cepheids
Cepheids are variable stars: they periodically change their size and temperature - and therefore their brightness. How this works in detail can be explained by the theory of stellar structure and development. They were named after the first known member of this class of stars, Delta Cephei.
Additionally it was observed (again in agreement with theoretical models) that there is relationship between the (average) brightness of these pulsating stars and the period of their oscillations. A diagram illustrating this relationship can be found e.g. at this page on the Cepheids and The discovery of Cepheid variables and the period-luminosity relation. This relationship was first noticed by Henrietta Leavitt for Cepheids in the Small Magellanic Cloud, a galaxy close to our own (approximately 200,000 light years away).
Because all the stars in the Small Magellanic Cloud have approximately the same distance to us, the observed relationship between apparent brightness and period implies that there is an equivalent relationship between absolute brightness and oscillation period. And indeed after determining the absolute brightnesses of lots of Cepheids (in the Small Magellanic Cloud and elsewhere), it turned out that there is such a universal relationship (different chemical composition has some influence on this, too, but this can usually be taken into account easily).
Hence if one wants to measure the distance of a cluster or a galaxy, one only has to find some Cepheids in it (they are quite bright stars, so that's not too hard, provided the galaxy isn't too far away even for this), measure their oscillation periods, and use this relationship to determine their absolute brightnesses. By comparing with the apparent brightnesses, one gets, as usual, their distances. If all of these distances agree with each other (which they usually do), the result is obviously the distance to the cluster or galaxy in which they are situated!
This works for galaxies which are up to a few tens of millions of light-years. For example, the distance to the galaxy M100 was determined to be around 56 million light years.
Obviously the crucial point in this method is that one has to know the relationship between the oscillation period and the absolute brightness with good precision. In order to determine this relationship, one has to determine the distances of some nearby Cepheids with good precision. In earlier times this was done using the H-R Diagram and similar techniques, but nowadays we have even measurements of Cepheid parallaxes available from the HIPPARCOS mission. The evaluation of these measurements is still difficult, but in general the new data tend to agree with the established earlier results. For more on this, see e.g. How is the Cepheid yardstick validated?, The Cepheid Distance Scale: A History, and the section "Measuring the Universe" on the page Hipparcos Pinpoints the Stars.
b) Supernovae
Another type of standard candle, which is very bright and hence can be used to determine the distances to galaxies even hundreds of millions of light years away, are the huge explosions which some stars experience close to the end of their lifetimes, so-called supernovae. You can find out more about them (and their misuse by creationists) at this page in the talk.origins archive: Supernovae, Supernova Remnants and Young Earth Creationism FAQ. Additionally, there are several pages on supernovae at Ask the Astronomer, for example What exactly happens to a star about to go supernova? and By what process do supernovae become Type I or Type II ?.
Depending on their masses, stars have different fates (please bear in mind that the following is a very short and simplified summary!): small stars, like our own sun, first grow bigger (when all the hydrogen is "burned" in their cores and the "burning" of helium starts) and get cooler, thereby turning into a red giant. After all the helium has been burned, too, they don't have any energy source left and start to shrink and cool off (often they expel lots of their outer shells before). The end results are the so-called white dwarfs.
Heavier stars don't stop after the red giant phase, the helium burning: more and more elements are fused together in their cores (this is possible because they have a higher pressure and temperature in their cores than the light stars), until iron is produced. Iron is the most stable element; fusing it costs energy instead of providing energy. Hence after the fusion reactions which led to iron, the stars haven't got any energy source left and have to collapse. This collapse causes the core of the star to turn into a neutron star (or even a black hole), and the material from the outer shells which falls onto this neutron star rebounces, aided by the enormous amount of energy released by the collapse of the core. The result is a huge explosion in which all the material from the outer shells of the star is expelled. We observe a sudden flash in brightness and later lots of outflowing debris (and in the case of SN1987A, even some neutrinos). In some cases, the remaining neutron star can even be identified. These explosions are called supernova type II. Some more information on them can be found e.g. at the HEASARC page on Supernovae.
Unfortunately, because there is no universal relationship between the brightness of the supernova II explosions and other easily observable parameters, these supernovae aren't very useful for cosmic distance determinations. But there is another type of supernova explosions, the so-called supernovae type I. These can only happen in binary systems: two stars which orbit each other. If they orbit each other closely, one of the stars can draw gases from the other (a process called accretion) to its surface. A special case now happens if the star which accretes the material from the other star is a white dwarf: if its total mass exceeds a certain limit (the Chandrasekhar limit), it starts to collapse. The resulting compression leads to explosive carbon fusion, and the huge amount of energy released thereby disrupts the whole white dwarf. What we observe here is a sudden increase in brightness, followed by a relatively slow (exponential) decay. This happens because the brightness results mainly from the radioactive decay of nickel and cobalt produced in the explosion (their spectral lines can be observed), and radioactive decay decreases exponentially with time.
What's important now is that there is a universal relationship between the decay rate of the observed light and the total brightness of the explosion. So by closely observing the light received from such an explosion and determining the rate at which this light becomes dimmer, one directly gets the absolute brightness of the supernova. By comparing this with the apparent brightness, one gets as usual the distance of the supernova - and thereby of the galaxy in which it was situated.
Recent measurements of very distant supernovae (Riess 1998) had strong cosmological implications: they showed that the expansion of the universe (see next section) is accelerating instead of decelerating, contrary to earlier expectations
4) The cosmological red shift
If one closely examines the spectra of far galaxies (at least several millions of light years away), one notices that the well-known spectral lines of the elements don't appear at the usual places, but are shifted: they all appear at (slightly) larger wavelengths than usual. Because "larger wavelength" corresponds to "redder" (red light has the longest wavelength of all visible light), this shift is called the red shift. Furthermore, the relative shift is the same for all spectral lines. This red shift was first noticed in 1926 by Hubble, who was also the first to identify individual stars in other galaxies (which were previously believed to be nebula inside our own galaxy). (Hubble 1926)
Such shifts are well-known phenomena for sound as well as light: they occur if the object which is emitting the waves is moving with respect to the observer. This is called the Doppler effect (it was already mentioned in section 1c). So, a natural interpretation is that the galaxies move with respect to us; a red shift implies that they move away from us (a blue shift would indicate that they move towards us; this can be e.g. seen in the spectra of the Andromeda galaxy which approaches our own galaxy because of the gravitational attraction between the two galaxies). Please note that the Doppler shift explanation is not the one used in modern cosmology for the red shift - it merely provides a nice, intuitive picture of what's going on! More on this below.
An important observation was made by Hubble in 1929 (Hubble 1929) after observing the red shifts of several galaxies: the red shift (and therefore the speed with which they fly away from us, in the Doppler interpretation) is directly proportional to the distances of the galaxies to us! This means that one can write the simple equation
v = H × d,
where v is the speed with which a galaxy recedes from us, d is its distance, and H is a constant (the same for all galaxies) called the Hubble constant or, more correctly, the Hubble parameter (because it isn't really a constant; more on this below). Back then, only very crude distance measurements were available (Hubble used Cepheids, for example, but the relationship between brightness and period wasn't very precisely known back then); with these, Hubble obtained
H = 500 kilometer/second/million parsec.
Modern measurements have shown that this is way to large; the currently agreed value is around
H = 70 kilometer/second/million parsec,
with an uncertainty in the measurements of less than 10%. This modern value was derived mainly from observations of Cepheids and supernovae I (Mould et al. 2000).
Hence we see that the farther away a galaxy is, the faster it recedes from us! Nowadays, this is explained using the Big Bang theory, which says that the whole universe expands. Try imagining the universe as the surface of a balloon, with the galaxies firmly attached to its surface. Now if the balloon is inflated, the galaxies obviously move away from each other, and the relative velocity of two galaxies is greater if their relative distance is greater. Hence the Big Bang theory doesn't say that the galaxies move away from each other - it says that the space between them increases, that space itself expands! In the Big Bang theory, the red shift is not due to the Doppler effect - it happens because during this cosmic expansion, the wavelengths of the light which a galaxy emits is stretched (because of the expansion of space itself). For more on these rather strange concepts, try reading e.g. Ned Wright's cosmology tutorial.
As the analogy with the inflating balloon already suggests, interpreting the red shift as being due to expansion of space itself leads to several deviations from the simple linear Hubble law above: first, because space is "curved", for large distances the red shift can't be directly proportional to the distance anymore, and second, because the "inflation rate" of the balloon isn't constant, H can't be a real constant - it has to vary with time. Both of these effects are taken into account by the Big Bang theory, which is derived from the Theory of General Relativity using some assumptions about the nature of the universe, like the cosmological principle (the universe looks essentially the same everywhere and in every direction; this is indeed true if one looks at really large scales, around 100 million light years) and the types of matter and energy in it.
Recently it turned out that the expansion of the universe is accelerating (a deceleration would be expected because of the gravitational attraction between all the galaxies). This is interpreted as evidence for so-called dark energy, which has the strange property of acting counter to gravity and hence pushing the galaxies apart (Riess 1998). Some sort of dark energy (a so-called cosmological constant) was already proposed by Einstein in his General Theory of Relativity in the 1920's, but he later abandoned this idea because the evidence available back then seemed to contradict it. Nowadays we know better; for example the results from WMAP (which used methods totally different from the supernova measurements) strongly supported the existence of this mysterious dark energy (and the value for the Hubble parameter found in the supernova studies).
Hence the method to determine the distance of really distant objects is quite simple: measure its red shift and plug the measured value into a formula provided by the Big Bang theory (similar to the simple Hubble law above, but more complicated, because more effects have to be taken into account) - this gives the distance. Unfortunately, the cosmological parameters which go into this formula (the Hubble parameter, the amount of matter and dark energy in the universe, and others) still aren't known with great precision, and therefore the distances calculated with this method aren't as reliable as the ones determined with other methods (the uncertainties can be up to 20%). But nevertheless the method is useful to get a first estimate of the distance if one doesn't want (or doesn't have the time or equipment) to use more sophisticated methodology.
Unfortunately, if distance measurements using this method are reported in the popular press, usually only the determined distance is given, not the measured red shift nor the used cosmological parameters; this can lead to the result that at different places, different distances are reported for the same object and the same study. Compare e.g. the article Galaxy's light pushes back dark ages of the universe with New record for Universe's most distant object; both talk about the same object and the same study, but nevertheless the first reports a distance of 15.5 billion light years, whereas the second says 13.6 billion light years!
A further complication is that it's not clear what is meant by "distance" here. Often what is reported is not the "real" distance, which the galaxy has today from us, but the time the light traveled in order to get to us. Yet another types of distance used in cosmology is the so-called luminosity distance, and there are several others more. When reading a (popular) science report of distances to far galaxies, one has to be careful in determining what is meant with "distance" there!
5) Standard objections by creationists
This section is mainly intended to stop those creationist who have read all the things above and think they can refute it with one single "witty" argument. Most of these arguments used by creationists are already well-known and have been refuted long ago. Giving detailed refutations here would make this FAQ much too long (and this isn't the original purpose of this FAQ), hence I simply explain the arguments and give references to rebuttals.
a) The light was created in transit
Often creationists accept that the methods outlined above give indeed correct results - with the caveat that they only give correct results for the observed light, and that this light doesn't need to correspond to real objects in the universe! In other words, they say that maybe the light wasn't really emitted by real astronomical objects, but simply created "in transit", on its way to earth. his, in their opinion, is a nice explanation for the ugly fact that we can see the light of objects which are apparently billions of light years away, although the universe is (in their opinion) only 6,000 years old. (a variation on this which I once saw is the mind-boggling argument "Maybe we can see the light already before it has reached us?")
Obviously this argument can't be refuted by science - but I don't think that this is necessary. Essentially this is an "appearance of age" argument - the universe is very young, but God designed it in a way that it looks very old. This is not only bad science, this is bad theology - it makes God look like a deceiver! Some creationists evade this by arguing that Adam and Eve were created "mature" and therefore the universe also had to be created "mature", i.e. old-looking, but I think this analogy makes no sense at all: a better analogy would be that Adam and Eve had been created not only mature, but with some scars from injuries which had never really happened!
Even the major creationist organizations Answers in Genesis and Institute for Creation Research have abandoned this argument (see the section "Created light?" in the article How can we see distant stars in a young universe?, and the section "Conclusion" in The current state of creationist astronomy ), using essentially the argument I presented here, but nevertheless there are still lots of creationists out there who think this is a valid argument.
b) Changing speed of light
Another argument which is also mentioned in How can we see distant stars in a young universe? is that maybe the speed of light has changed, that it was faster in the past. A strong proponent of this thesis is Barry Setterfield. Obviously if the speed of light was far greater in the past, light from objects which are billions of light years away could have reached earth in just a few thousand years! Setterfields' argument are discussed (and shred to pieces) in lots of articles, including the article at Answers in Genesis mentioned above. Some useful references are:
- A Changing Speed of Light? and links therein
- A6. The Distance to Supernova SN1987A and the Speed of Light
- The Decay of c-decay
- If Setterfield is right, Adam and Eve were icicles
A common idea is to use "clocks" with known rates (such as pulsars, rotating neutron stars which periodically emit radio pulses), look what a changing speed of light predicts for observations of these rates, and compare these predictions with the real data.
c) Problems with red shift
Another standard attack against distance measurements is that our interpretation of the cause of red shift is wrong (such attacks often come from people who think that cosmologists say that the red shift is due to the Doppler effect; a nice example for such nonsense is Quasars and the Big Bang). Prominent attacks against the cosmological red shift interpretation were the so-called "tired light" hypothesis (the light looses energy on its way to us) and the "quantization of red shift" (the claim that red shifts are somehow periodic and occur only as multiples of a certain basic red shift; this assertion was also embraced by Setterfield).
Again, there are lots of refutations concerning these ideas on the web; the most important two are in my opinion:
- Errors in Tired Light Cosmology
- No Periodicities in 2dF Redshift Survey Data (this is a fairly technical paper, but the conclusion should be clear)
There is one additional strong piece of evidence that red shift is indeed cosmological and not due to one of these other explanations. Between distant quasars and us, there are usually lots of gas clouds which absorb light. Therefore we get (dark) absorption lines in the spectra of these quasars. But because these gas clouds are at different distances from us, most also at distances where red shift is not negligible, we get not only one absorption line, but several different (one for every gas cloud at every different distance and therefore different red shift). Hence what one gets in the spectrum usually is a "forest" of lots of absorption lines at different wavelengths. Because the absorption line one usually studies is called the Lyman alpha line, this phenomenon is called the Lyman alpha forest. Now if the red shift really is cosmological and depends on distance, one should observe that all these absorption lines have lesser red shift than the emission line of the quasar behind all these gas clouds. And that's indeed what's observed!
Here is a (fairly technical) paper which reports the observations: Evidence consistent with the cosmological interpretation of quasar redshifts. You can find more information on this topic on the Bad Astronomy Bulletin Board: Redshifts are cosmological: the Lyman Alpha Forest and Arp.
d) Russell Humphreys' Starlight and Time
In 2000,
Dr. Russell Humphreys published his book
Starlight and Time. In it, he proposed an alternative
to the Big Bang theory: he claimed that if one uses General
Relativity, but assumes (in contrast to the standard Big
Bang theory) that the universe has a center and a boundary,
one can construct a model in which the time at this center
runs much slower than in the outer regions. There has been
much debate on this, and even other creationists have
pointed out that there are errors in his model (see for
example the comment "This criticism has led the
editorial staff of the ICC to conclude that there was a
failure in the peer review process of Humphreys' 1994 paper
[29] in which he first publicly presented his model."
in The
current state of creation astronomy). Nevertheless, the
major creationist organizations Answers in Genesis and
Institute for Creation Research still favor it (see How can
we see distant stars in a young universe? and The
current state of creation astronomy). The Old Earth
Creationist (OEC) organization Reasons to Believe published the
following
rebuttal to Humphreys' model, including his later
changes in the model (which, as far as I know, didn't lead
to the publication of a new, updated book).
A longer, quite technical comment (also from an OEC) is Starlight and Time is the Big Bang. It contains lots of valuable arguments against Humphreys' model.
Here is yet another rather technical rebuttal: Error's in Humphreys' cosmological model, which includes a reply by Humphreys.
More criticisms of Humphreys' model, and his replies thereto, can be found at Russell Humphreys answers Various Critics.
Also interesting is Tim Thompson's comment in the talk.origins feedback from April 2003.
e)A discussion between Ross and Hovind
In October 2000, there was a debate between Dr. Hugh Ross, an Old Earth Creationist, and the YEC Kent Hovind. You can purchase it on the homepage of The John Ankerberg show or at Reasons to Believe. Answers in Genesis (AiG) subsequently published Hugh Ross lays down the gauntlet! in which they present some (real) errors which Ross made during the debate. Ross mentioned the geometric distance measurements to 3C 279 and NGC 4258 explained in section 1c, correctly pointing out that these are billions respectively millions of light years away, but falsely claiming that these were parallax measurements (see section 1c for an explanation for the real method of measurement). AiG corrects Ross (without making further blunders, as far as I can see), but nevertheless admits that vast distances in the universe are probably real (their caveat is Humphrey's model, see above).
f) Gentry
Yet another model for a universe with a center came from YEC Robert V. Gentry who is best known for his polonium halo claims. In his model, the universe is static and surrounded by a shell of hydrogen. Additionally, he uses a sort of dark energy which acts counter to gravity. There are two rather technical papers on his model: A New Redshift Interpretation and The Genuine Cosmic Rosetta.
A technical rebuttal of Gentry's model is the paper Remarks on the "New Redshift Interpretation". Additionally, there exists the talk.origins FAQ Debunking Robert Gentry's "New Redshift Interpretation" Cosmology
6) Summary
- Geometric parallaxes have been measured out to distances which are already challenging the less-than-10,000-year "young universe hypothesis". In the next few years, with the launch of GAIA, the results will go out to more than 30,000 light years.
- Geometric measurements to objects which are thousands, millions and even billions of light years away are available, using sensible physical models for the observed objects.
- Other methods rely on a well-established model for just what stars are and how they change during their life times. At least, the billions of stars in our galaxy, if they are stars at all (rather than just mysterious points of light), have to be many tens of thousands of light years away.
- The methods for determining distances to very distant objects rely on well-studied "standard candles".
- All the findings so far have been consistent with predictions of the theory of stellar development and the Big Bang theory.
Finally, one has to realize that although the methods used to determine distances seem to rely heavily on each other (as I mentioned in the introduction, one uses a kind of "ladder" of different methods), there exists instead a whole web of self-correcting and interlocking methods which all come to the same conclusions. The assumptions which go into the methods are justified by the fact that we get consistent results if we use these assumptions.
References
Brisken, W. F. et al., Very Long Baseline Array measurement of nine pulsar parallaxes, Astrophysical Journal 571, 906 (2002). http://adsabs.harvard.edu/cgi-bin/nph-bib_query?bibcode=2002ApJ...571..906B
Eisenhauer F. et al, A Geometric Determination of the Distance to the Galactic Center (2003).http://xxx.lanl.gov/abs/astro-ph/0306220
Herrnstein, J. R. et al., A geometric distance to the galaxy NGC4258 from orbital motions in a nuclear gas disk, Nature 400, 539 (1999). http://www.nature.com/cgi-taf/DynaPage.taf?file=/nature/journal/v400/n6744/abs/400539a0_fs.html
Homan, D.C. and J. F. C. Wardle, Direct distance measurements to superluminal radio sources, Astrophysical Journal 535, 575 (2000). http://adsabs.harvard.edu/cgi-bin/nph-bib_query?bibcode=2000ApJ...535..575H
Hubble, E. P., A Spiral Nebula as a Stellar System. Messier 33, Astrophysical Journal 63, 236 (1926). http://adsabs.harvard.edu/cgi-bin/nph-bib_query?bibcode=1926ApJ....63..236H
Hubble, E. P., A relation between distance and radial velocity among extra-galactic nebulae, Proceedings of the National Academy of Sciences 15 (1929). http://antwrp.gsfc.nasa.gov/diamond_jubilee/1996/hub_1929.html
Mould, J. R. et al., The Hubble Space Telescope Key Project on the Extragalactic Distance Scale. XXVIII. Combining the constraints on the Hubble constant, Astrophysical Journal 529, 786 (2000). http://adsabs.harvard.edu/cgi-bin/nph-bib_query?bibcode=2000ApJ...529..786M
Panagia, N. et al., Properties of the SN 1987A circumstellar ring and the distance to the Large Magellanic Cloud, Astrophysical Journal 380, L23-26 (1991) http://adsabs.harvard.edu/cgi-bin/nph-bib_query?bibcode=1991ApJ...380L..23P ; Sky & Telescope, February 1997.
Riess, A. G. et al., Observational evidence from supernovae for an accelerating universe and a cosmological constant, Astronomical Journal 116, 1009 (1998). http://adsabs.harvard.edu/cgi-bin/nph-bib_query?bibcode=1998AJ....116.1009R
Acknowledgements
I would like to thank Steve Carlip, Dan Day, Jon Fleming, Michael Hopkins, Tom Scharle, Phill Skelton, and Arne Vogel for lots of valuable comments, corrections and additions.