RADIOMETRIC DATING
The question of the ages of the Earth and its rock formations and features has fascinated philosophers, theologians, and scientists for centuries, primarily because the answers put our lives in temporal perspective. Until the 18th century, this question was principally in the hands of theologians, who based their calculations on biblical chronology. Bishop James Ussher, a 17th-century Irish cleric, for example, calculated that creation occurred in 4004 B.C. There were many other such estimates, but they invariably resulted in an Earth only a few thousand years old.
By the late 18th century, some naturalists had begun to look closely at the ancient rocks of the Earth. They observed that every rock formation, no matter how ancient, appeared to be formed from still older rocks. Comparing these rocks with the products of present erosion, sedimentation, and earth movements, these earliest geologists soon concluded that the time required to form and sculpt the present Earth was immeasurably longer than had previously been thought. James Hutton, a physician-farmer and one of the founders of the science of geology, wrote in 1788, “The result, therefore, of our present inquiry is, that we find no vestige of a beginning, — no prospect of an end.” Although this may now sound like an overstatement, it nicely expresses the tremendous intellectual leap required when geologic time was finally and forever severed from the artificial limits imposed by the length of the human lifetime.
By the mid- to late 1800s, geologists, physicists, and chemists were searching for ways to quantify the age of the Earth. Lord Kelvin and Clarence King calculated the length of time required for the Earth to cool from a white-hot liquid state; they eventually settled on 24 million years. James Joly calculated that the Earth’s age was 89 million years on the basis of the time required for salt to accumulate in the oceans. There were other estimates but the calculations were hotly disputed because they all were obviously flawed by uncertainties in both the initial assumptions and the data.
Unbeknownst to the scientists engaged in this controversy, however, geology was about to be profoundly affected by the same discoveries that revolutionized physics at the turn of the 20th century. The discovery of radioactivity in 1896 by Henri Becquerel, the isolation of radium by Marie Curie shortly thereafter, the discovery of the radioactive decay laws in 1902 by Ernest Rutherford and Frederick Soddy, the discovery of isotopes in 1910 by Soddy, and the development of the quantitative mass spectrograph in 1914 by J. J. Thomson all formed the foundation of modern isotopic dating methods. But it was not until the late 1950s that all the pieces were in place; by then the phenomenon of radioactivity was understood, most of the naturally occurring isotopes had been identified and their abundance determined, instrumentation of the necessary sensitivity had been developed, isotopic tracers were available in the required quantities and purity, and the half-lives of the long-lived radioactive isotopes were reasonably well known. By the early 1960s, most of the major radiometric dating techniques now in use had been tested and their general limitations were known.
No technique, of course, is ever completely perfected and refinement continues to this day, but for more than two decades radiometric dating methods have been used to measure reliably the ages of rocks, the Earth, meteorites, and, since 1969, the Moon.
Radiometric dating is based on the decay of long-lived radioactive isotopes that occur naturally in rocks and minerals. These parent isotopes decay to stable daughter isotopes at rates that can be measured experimentally and are effectively constant over time regardless of physical or chemical conditions. There are a number of long-lived radioactive isotopes used in radiometric dating, and a variety of ways they are used to determine the ages of rocks, minerals, and organic materials. Some of the isotopic parents, end-product daughters, and half-lives involved are listed in Table 1. Sometimes these decay schemes are used individually to determine an age (e.g., Rb-Sr) and sometimes in combinations (e.g., U-Th-Pb). Each of the various decay schemes and dating methods has unique characteristics that make it applicable to particular geologic situations. For example, a method based on a parent isotope with a very long half-life, such as 147Sm, is not very useful for measuring the age of a rock only a few million years old because insufficient amounts of the daughter isotope accumulate in this short time. Likewise, the 14C method can only be used to determine the ages of certain types of young organic material and is useless on old granites. Some methods work only on closed systems, whereas others work on open systems.1 The point is that not all methods are applicable to all rocks of all ages. One of the primary functions of the dating specialist (sometimes called a geochronologist) is to select the applicable method for the particular problem to be solved, and to design the experiment in such a way that there will be checks on the reliability of the results. Some of the methods have internal checks, so that the data themselves provide good evidence of reliability or lack thereof. Commonly, a radiometric age is checked by other evidence, such as the relative order of rock units as observed in the field, age measurements based on other decay schemes, or ages on several samples from the same rock unit. The main point is that the ages of rock formations are rarely based on a single, isolated age measurement. On the contrary, radiometric ages are verified whenever possible and practical, and are evaluated by considering other relevant data.
| Parent isotope |
End product (daughter) isotope |
Half-life (years) |
|---|---|---|
| potassium-40 (40K) | argon-40 (40Ar) | 1.25 × 10⁹ |
| rubidium-87 (87Rb) | strontium-87 (87Sr) | 4.88 × 10¹⁰ |
| carbon-14 (14C) | nitrogen-14 (14N) | 5.73 × 10³ |
| uranium-235 (235O) | lead-207 (207Pb) | 7.04 × 10⁸ |
| uranium-238 (238O) | lead-206 (206Pb) | 4.47 × 10⁹ |
| thorium-232 (232Th) | lead-208 (208Pb) | 1.40 × 10¹⁰ |
| lutetium-176 (176Lu) | hafnium-176 (176Hf) | 3.5 × 10¹⁰ |
| rhenium-187 (187Re) | osmium-187 (187Os) | 4.3 × 10¹⁰ |
| samarium-147 (147Sm) | neodymium-143 (143Nd) | 1.06 × 10¹¹ |
My purpose here is not to review and discuss all of the dating methods in use. Instead, I describe briefly only the three principal methods. These are the K-Ar, Rb-Sr, and U-Pb methods. These are the three methods most commonly used by scientists to determine the ages of rocks because they have the broadest range of applicability and are highly reliable when properly used. These are also the methods most commonly criticized by creation “scientists.” For additional information on these methods or on methods not covered here, the reader is referred to the books by Faul (47), Dalrymple and Lanphere (35), Doe (38), York and Farquhar (136), Faure and Powell (50), Faure (49), and Jager and Hunziker (70), as well as the article by Dalrymple (32).
THE K-Ar METHOD
The K-Ar method is probably the most widely used radiometric dating technique available to geologists. It is based on the radioactivity of 40K, which undergoes dual decay by electron capture to 40Ar and by beta emission to 40Ca. The ratio of 40K atoms that decay to 40Ar to those that decay to 40Ca is 0.117, which is called the branching ratio. Because 40Ca is practically ubiquitous in rocks and minerals and is relatively abundant, it is usually not possible to correct for the 40Ca initially present and so the 40K/40Ca method is rarely used for dating. 40Ar, however, is an inert gas that escapes easily from rocks when they are heated but is trapped within the crystal structures of many minerals after a rock cools. Thus, in principle, while a rock is molten the 40Ar formed by the decay of 40K escapes from the liquid. After the rock has solidified and cooled, the radiogenic 40Ar is trapped within the solid crystals and accumulates with the passage of time. If the rock is heated or melted at some later time, then some or all of the 40Ar may be released and the clock partially or totally reset.
In the process of analysis, a correction must be made for the atmospheric argon2 present in most minerals and in the vacuum apparatus used for the analyses. This correction is easily made by measuring the amount of 36Ar present and, using the known isotopic composition of atmospheric argon (40Ar/ 36Ar = 295.5), subtracting the appropriate amount of 40Ar due to atmospheric contamination. What is left is the amount of radiogenic 40Ar. This correction can be made very accurately and has no appreciable effect on the calculated age unless the atmospheric argon is a very large proportion of the total argon in the analysis. The geochronologist takes this factor into account when assigning experimental errors to the calculated ages.
The K-Ar method has two principal requirements. First, there must be no argon other than that of atmospheric composition trapped in the rock or mineral when it forms. Second, the rock or mineral must not lose or gain either potassium or argon from the time of its formation to the time of analysis. By many experiments over the past three decades, geologists have learned which types of rocks and minerals meet these requirements and which do not. The K-Ar clock works primarily on igneous rocks, i.e., those that form from a rock liquid (such as lava and granite) and have simple post-formation histories. It does not work well on sedimentary rocks because these rocks are composed of debris from older rocks. It does not work well on most metamorphic rocks because this type of rock usually has a complex history, often involving one or more heatings after initial formation. The method does work on certain minerals that retain argon well, such as muscovite, biotite, and volcanic feldspar, but not on other minerals, such as feldspar from granite rocks, because they leak their argon even at low temperatures. The method works well on subaerial lava flows, but not on most submarine pillow basalts because they commonly trap excess 40Ar when they solidify. One of the principal tasks of the geochronologist is to select the type of material used for a dating analysis. A great deal of effort goes into the sample selection, and the choices are made before the analysis, not on the basis of the results. Mistakes do occur but they are usually caught by the various checks employed in the well-designed experiment.
THE Rb-Sr METHOD
The Rb-Sr method is based on the radioactivity of 87Rb, which undergoes simple beta decay to 87Sr with a half-life of 48.8 billion years. Rubidium is a major constituent of very few minerals, but the chemistry of rubidium is similar to that of potassium and sodium, both of which do form many common minerals, and so rubidium occurs as a trace element in most rocks. Because of the very long half-life of 87Rb, Rb-Sr dating is used mostly on rocks older than about 50 to 100 million years. This method is very useful on rocks with complex histories because the daughter product, strontium, does not escape from minerals nearly so easily as does argon. As a result, a sample can obey the closed-system requirements for Rb-Sr dating over a wider range of geologic conditions than can a sample for K-Ar dating.
Unlike argon, which escapes easily and entirely from most molten rocks, strontium is present as a trace element in most minerals when they form. For this reason, simple Rb-Sr ages can be calculated only for those minerals that are high in rubidium and contain a negligible amount of initial strontium. In such minerals, the calculated age is insensitive to the initial strontium amount and composition. For most rocks, however, initial strontium is present in significant amounts, so dating is done by the isochron method, which completely eliminates the problem of initial strontium.
Other Links:
|
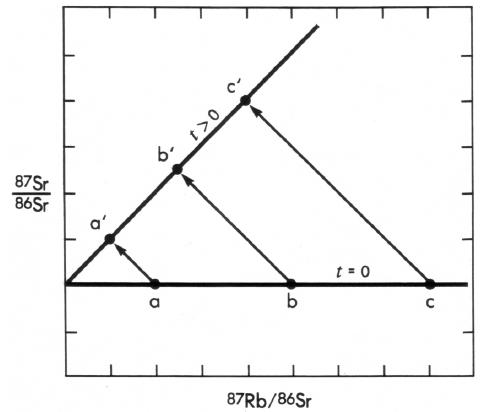
In the Rb-Sr isochron method, several (three or more) minerals from the same rock, or several cogenetic rocks with different rubidium and strontium contents, are analyzed and the data plotted on an isochron diagram (Figure 2). The 87Rb and 87Sr contents are normalized to the amount of 86Sr, which is not a radiogenic daughter product. When a rock is first formed, say from a magma, the 87Sr/86Sr ratios in all of the minerals will be the same regardless of the rubidium or strontium contents of the minerals, so all of the samples will plot on a horizontal line (a-b-c in Figure 2). The intercept of this line with the ordinate represents the isotopic composition of the initial strontium. From then on, as each atom of 87Rb decays to 87Sr, the points will follow the paths3 shown by the arrows. At any time after formation, the points will lie along some line a’-b’-c’ (Figure 2), whose slope will be a function of the age of the rock. The intercept of the line on the ordinate gives the isotopic composition of the initial strontium present when the rock formed. Note that the intercepts of lines a-b-c and a'-b'-c' are identical, so the initial strontium isotopic composition can be determined from this intercept regardless of the age of the rock.
|
Note that the Rb-Sr isochron method requires no knowledge or assumptions about either the isotopic composition or the amount of the initial daughter isotope — in fact, these are learned from the method. The rocks or minerals must have remained systems closed to rubidium and strontium since their formation; if this condition is not true, then the data will not plot on an isochron. Also, if either the initial isotopic composition of strontium is not uniform or the samples analyzed are not cogenetic, then the data will not fall on a straight line. As the reader can easily see, the Rb-Sr isochron method is elegantly self-checking. If the requirements of the method have been violated, the data clearly show it.
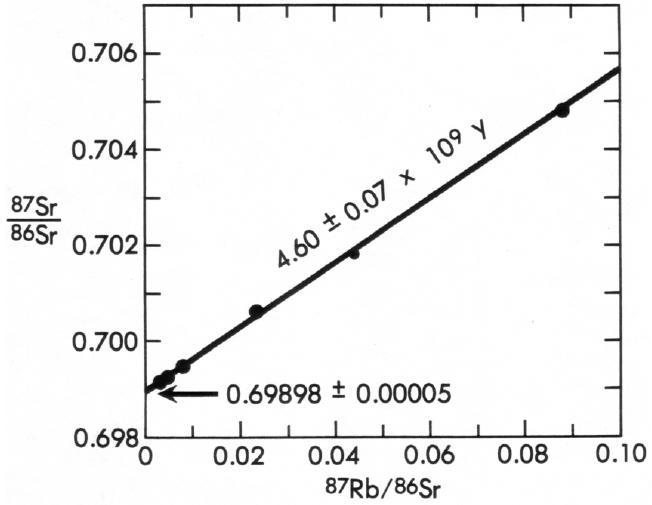
An example of a Rb-Sr isochron is shown in Figure 3, which includes analyses of five separate phases from the meteorite Juvinas (3). The data form an isochron indicating an age for Juvinas of 4.60 ± 0.07 billion years. This meteorite has also been dated by the Sm-Nd isochron method, which works like the Rb-Sr isochron method, at 4.56 ± 0.08 billion years (84).
|
THE U-Pb METHOD
The U-Pb method relies on the decays of 235U and 238U. These two parent isotopes undergo series decay involving several intermediate radioactive daughter isotopes before the stable daughter product, lead (Table 1), is reached.
Two simple independent “age” calculations can be made from the two U-Pb decays: 238U to 206Pb, and 235U to 207Pb. In addition, an “age” based on the 207Pb/206Pb ratio can be calculated because this ratio changes over time. If necessary, a correction can be made for the initial lead in these systems using 204Pb as an index. If these three age calculations agree, then the age represents the true age of the rock. Lead, however, is a volatile element, and so lead loss is commonly a problem. As a result, simple U-Pb ages are often discordant.
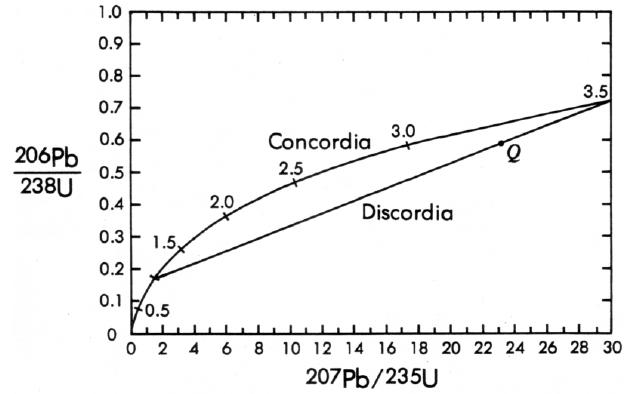
The U-Pb concordia-discordia method circumvents the problem of lead loss in discordant systems and provides an internal check on reliability. This method involves the 238U and 235U decays and is used in such minerals as zircon, a common accessory mineral in igneous rocks, that contains uranium but no or negligible initial lead. This latter requirement can be checked, if necessary, by checking for the presence of 204Pb, which would indicate the presence and amount of initial lead. In a closed lead-free system, a point representing the 206Pb/238U and 2O7Pb/235U ratios will plot on a curved line known as concordia (Figure 4). The location of the point on concordia depends only on the age of the sample. If at some later date (say, 2.5 billion years after formation) the sample loses lead in an episodic event, the point will move off of concordia along a straight line toward the origin. At any time after the episodic lead loss (say, 1.0 billion years later), the point Q in Figure 4 will lie on a chord to concordia connecting the original age of the sample and the age of the lead loss episode. This chord is called discordia. If we now consider what would happen to several different samples, say different zircons, from the same rock, each of which lost differing amounts of lead during the episode, we find that at any time after the lead loss, say today, all of the points for these samples will lie on discordia. The upper intercept of discordia with concordia gives the original age of the rock, or 3.5 billion years in the example shown in Figure 4. There are several hypotheses for the interpretation of the lower intercept, but the most common interpretation is that it indicates the age of the event that caused the lead loss, or 1 billion years in Figure 4. Note that this method is not only self-checking, but it also works on open systems. What about uranium loss? Uranium is so refractory that its loss does not seem to be a problem. If uranium were lost, however, the concordia-discordia plot would indicate that also.
|
The U-Pb concordia-discordia method is one of the most powerful and reliable dating methods available. It is especially resistant to heating and metamorphic events and thus is extremely useful in rocks with complex histories. Quite often this method is used in conjunction with the K-Ar and the Rb-Sr isochron methods to unravel the history of metamorphic rocks, because each of these methods responds differently to metamorphism and heating. For example, the U-Pb discordia age might give the age of initial formation of the rock, whereas the K-Ar method, which is especially sensitive to argon loss by heating, might give the age of the latest heating event.
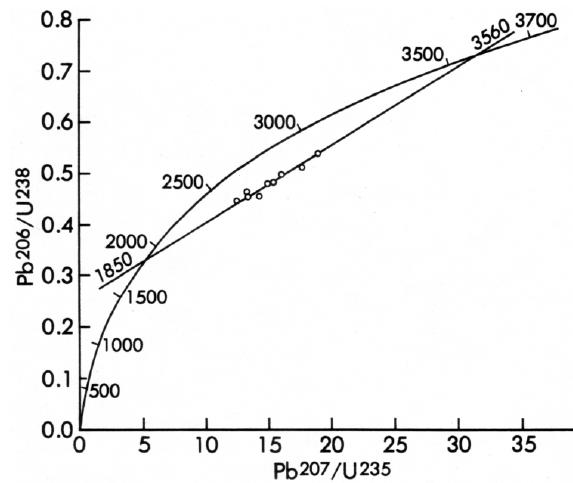
An example of a U-Pb discordia age is shown in Figure 5. This example shows an age of 3.56 billion years for the oldest rocks yet found in North America, and an age of 1.85 billion years for the latest heating event experience by these rocks. The K-Ar ages on rocks and minerals from this area in southwestern Minnesota also record this 1.85-billion-year heating event.
|
SOME CREATIONIST CRITICISMS OF RADIOMETRIC DATING
“ANOMALOUS” AGES
The advocates of “scientific” creationism frequently point to apparent inconsistencies in radiometric dating results as evidence invalidating the techniques. This argument is specious and akin to concluding that all wristwatches do not work because you happen to find one that does not keep accurate time. In fact, the number of “wrong” ages amounts to only a few percent of the total, and nearly all of these are due to unrecognized geologic factors, to unintentional misapplication of the techniques, or to technical difficulties. Like any complex procedure, radiometric dating does not work all the time under all circumstances. Each technique works only under a particular set of geologic conditions and occasionally a method is inadvertently misapplied. In addition, scientists are continually learning, and some of the “errors” are not errors at all but simply results obtained in the continuing effort to explore and improve the methods and their application. There are, to be sure, inconsistencies, errors, and results that are poorly understood, but these are very few in comparison with the vast body of consistent and sensible results that clearly indicate that the methods do work and that the results, properly applied and carefully evaluated, can be trusted.
Most of the “anomalous” ages cited by creation “scientists” in their attempt to discredit radiometric dating are actually misrepresentations of the data, commonly cited out of context and misinterpreted. A few examples will demonstrate that their criticisms are without merit.
The Woodmorappe List
The creationist author J. Woodmorappe (134) lists more than 300 supposedly “anomalous” radiometric ages that he has culled from the scientific literature. He claims that these examples cast serious doubt on the validity of radiometric dating.
The use of radiometric dating in Geology involves a very selective acceptance of data. Discrepant dates, attributed to open systems, may instead be evidence against the validity of radiometric dating. (134, p. 102)
However, close examination of his examples, a few of which are listed in Table 2, shows that he misrepresents both the data and their meaning.
| *This example was not tabulated by Woodmorappe (134) but was discussed in his text. | ||
| Expected age (million years) |
Age obtained (million years) |
Formation/locality |
|---|---|---|
| 52 | 39 | Winona Sand/gulf coast |
| 60 | 38 | Not given/gulf coast |
| 140 | 163,186 | Coast Range batholith/Alaska |
| 185 | 186-1230 | Diabase dikes/Liberia |
| - | 34,000* | Pahrump Group diabase/California |
The two ages from gulf coast localities (Table 2) are from a report by Evernden and others (43). These are K-Ar data obtained on glauconite, a potassium-bearing clay mineral that forms in some marine sediment. Woodmorappe (134) fails to mention, however, that these data were obtained as part of a controlled experiment to test, on samples of known age, the applicability of the K-Ar method to glauconite and to illite, another clay mineral. He also neglects to mention that most of the 89 K-Ar ages reported in their study agree very well with the expected ages. Evernden and others (43) found that these clay minerals are extremely susceptible to argon loss when heated even slightly, such as occurs when sedimentary rocks are deeply buried. As a result, glauconite is used for dating only with extreme caution. Woodmorappe’s gulf coast examples are, in fact, examples from a carefully designed experiment to test the validity of a new technique on an untried material.
The ages from the Coast Range batholith in Alaska (Table 2) are referenced by Woodmorappe (134) to a report by Lanphere and others (80). Whereas Lanphere and his colleagues referred to these two K-Ar ages of 163 and 186 million years, the ages are actually from another report and were obtained from samples collected at two localities in Canada, not Alaska. There is nothing wrong with these ages; they are consistent with the known geologic relations and represent the crystallization ages of the Canadian samples. Where Woodmorappe obtained his 140-million-year “expected” age is anyone’s guess because it does not appear in the report he cites.
The Liberian example (Table 2) is from a report by Dalrymple and others (34). These authors studied dikes of basalt that intruded Precambrian crystalline basement rocks and Mesozoic sedimentary rocks in western Liberia. The dikes cutting the Precambrian basement gave K-Ar ages ranging from 186 to 1213 million years (Woodmorappe erroneously lists this higher age as 1230 million years), whereas those cutting the Mesozoic sedimentary rocks gave K-Ar ages of from 173 to 192 million years. 40Ar/39Ar experiments4 on samples of the dikes showed that the dikes cutting the Precambrian basement contained excess 40Ar and that the calculated ages of the dikes do not represent crystallization ages. The 40Ar/39Ar experiments on the dikes that intrude the Mesozoic sedimentary rocks, however, showed that the ages on these dikes were reliable. Woodmorappe (134) does not mention that the experiments in this study were designed such that the anomalous results were evident, the cause of the anomalous results was discovered, and the crystallization ages of the Liberian dikes were unambiguously determined. The Liberian study is, in fact, an excellent example of how geochronologists design experiments so that the results can be checked and verified.
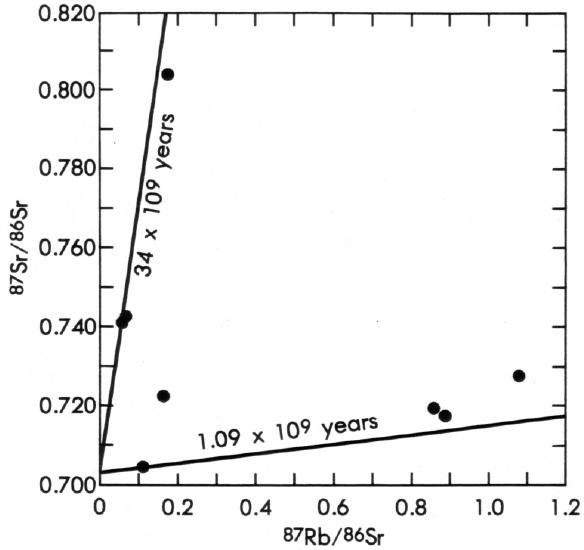
The final example listed in Table 2 is a supposed 34 billion-year Rb-Sr isochron age on diabase of the Pahrump Group from Panamint Valley, California, and is referenced to a book by Faure and Powell (50). Again, Woodmorappe (134) badly misrepresents the facts. The “isochron” that Woodmorappe (134) refers to is shown in Figure 6 as it appears in Faure and Powell (50). The data do not fall on any straight line and do not, therefore, form an isochron. The original data are from a report by Wasserburg and others (130), who plotted the data as shown but did not draw a 34-billion-year isochron on the diagram. The “isochrons” lines were drawn by Faure and Powell (50) as “reference isochrons” solely for the purpose of showing the magnitude of the scatter in the data.
|
As discussed above, one feature of the Rb-Sr isochron diagram is that, to a great extent, it is self-diagnostic. The scatter of the data in Figure 6 shows clearly that the sample has been an open system to 87Sr (and perhaps to other isotopes as well) and that no meaningful Rb-Sr age can be calculated from these data. This conclusion was clearly stated by both Wasserburg and others (130) and by Faure and Powell (50). The interpretation that the data represent a 34 billion-year isochron is solely Woodmorappe’s (134) and is patently wrong.
The Reunion “Discordance”
A series of volcanic rocks from Reunion Island in the Indian Ocean gives K/Ar ages ranging from 100,000 to 2 million years, whereas the 206Pb/238U and 206Pb/207Pb ages are from 2.2 to 4.4 billion years. The factor of discordance between ‘ages’ is as high as 14,000 in some samples. (77, p. 201)
There are two things wrong with this argument. First, the lead data that Kofahl and Segraves (77) cite, which come from a report by Oversby (102), are common lead measurements done primarily to obtain information on the genesis of the Reunion lavas and secondarily to estimate when the parent magma the lava was derived from was separated from primitive mantle material. These data cannot be used to calculate the age of the lava flows and no knowledgeable scientist would attempt to do so. Second, the U-Pb and Pb-Pb lava “ages” cited by Kofahl and Segraves do not appear in Oversby’s report. The K-Ar ages are the correct ages of the Reunion lava flows, whereas the U-Pb and Pb-Pb “ages” do not exist! We can only speculate on where Kofahl and Segraves obtained their numbers.
The Hawaiian Basalts
Still another study on Hawaiian basalts obtained seven “ages” of these basalts ranging all the way from zero years to 3.34 million years. The authors, by an obviously unorthodox application of statistical reasoning, felt justified in recording the “age” of these basalts as 250,000 years. (92, p. 147)
The data Morris (92) refers to were published by Evernden and others (44), but include samples from different islands that formed at different times! The age of 3.34 million years is from the Napali Formation on the Island of Kauai and is consistent with other ages on this formation (86, 87). The approximate age of 250,000 years was the mean of the results from four samples from the Island of Hawaii, which is much younger than Kauai. Contrary to Morris’ concerns, nothing is amiss with these data, and the statistical reasoning used by Evernden and his colleagues is perfectly rational and orthodox.
The Kilauea Submarine Pillow Basalts
Many of the rocks seem to have inherited Ar40 from the magma from which the rocks were derived. Volcanic rocks erupted into the ocean definitely inherit Ar40 and helium and thus when these are dated by the K40-Ar40 clock, old ages are obtained for very recent flows. For example, lavas taken from the ocean bottom off the island [sic] of Hawaii on a submarine extension of the east rift zone of Kilauea volcano gave an age of 22 million years, but the actual flow happened less than 200 years ago. (117, p. 39, and similar statements in 92)
Slusher (117) and Morris (92) advanced this argument in an attempt to show that the K-Ar method is unreliable, but the argument is a red herring.
Two studies independently discovered that the glassy margins of submarine pillow basalts, so named because lava extruded under water forms globular shapes resembling pillows, trap 40Ar dissolved in the melt before it can escape (36, 101). This effect is most serious in the rims of the pillows and increases in severity with water depth. The excess 40Ar content approaches zero toward pillow interiors, which cool more slowly and allow the 40Ar to escape, and in water depths of less than about 1000 meters because of the lessening of hydrostatic pressure. The purpose of these two studies was to determine, in a controlled experiment with samples of known age, the suitability of submarine pillow basalts for dating, because it was suspected that such samples might be unreliable. Such studies are not unusual because each different type of mineral and rock has to be tested carefully before it can be used for any radiometric dating technique. In the case of the submarine pillow basalts, the results clearly indicated that these rocks are unsuitable for dating, and so they are not generally used for this purpose except in special circumstances and unless there is some independent way of verifying the results.
“Excess” Argon in Lunar Rocks
On the other hand, many lunar rocks contain such large quantities of what is considered to be excess argon that dating by K/Ar is not even reported. (77, p. 200)
The citation for this statement is to a report by Turner (128). Turner, however, made no such comment about excess argon in lunar rocks, and there are no data in his report on which such a conclusion could be based. The statement by Rofahl and Segraves (77) is simply unjustifiable.
The 1801 Flow from Hualalai Volcano
Volcanic rocks produced by lava flows which occurred in Hawaii in the years 1800-1801 were dated by the potassium-argon method. Excess argon produced apparent ages ranging from 160 million to 2.96 billion years. (77, p. 200)
Similar modern rocks formed in 1801 near Hualalai, Hawaii, were found to give potassium-argon ages ranging from 160 million years to 3 billion years. (92, p. 147)
Kofahl and Segraves (77) and Morris (92) cite a study by Funkhouser and Naughton (51) on xenolithic inclusions in the 1801 flow from Hualalai Volcano on the Island of Hawaii.
The 1801 flow is unusual because it carries very abundant inclusions of rocks foreign to the lava. These inclusions, called xenoliths (meaning foreign rocks), consist primarily of olivine, a pale-green iron-magnesium silicate mineral. They come from deep within the mantle and were carried upward to the surface by the lava. In the field, they look like large raisins in a pudding and even occur in beds piled one on top of the other, glued together by the lava. The study by Funkhouser and Naughton (51) was on the xenoliths, not on the lava. The xenoliths, which vary in composition and range in size from single mineral grains to rocks as big as basketballs, do, indeed, carry excess argon in large amounts. Funkhouser and Naughton were quite careful to point out that the apparent “ages” they measured were not geologically meaningful. Quite simply, xenoliths are one of the types of rocks that cannot be dated by the K-Ar technique. Funkhouser and Naughton were able to determine that the excess gas resides primarily in fluid bubbles in the minerals of the xenoliths, where it cannot escape upon reaching the surface. Studies such as the one by Funkhouser and Naughton are routinely done to ascertain which materials are suitable for dating and which are not, and to determine the cause of sometimes strange results. They are part of a continuing effort to learn.
Two extensive K-Ar studies on historical lava flows from around the world (31, 79) showed that excess argon is not a serious problem for dating lava flows. The authors of these reports “dated” numerous lava flows whose age was known from historical records. In nearly every case, the measured K-Ar age was zero, as expected if excess argon is uncommon. An exception is the lava from the 1801 Hualalai flow, which is so badly contaminated by the xenoliths that it is impossible to obtain a completely inclusion-free sample.
METHODOLOGY
Creation “scientists” commonly criticize the systematics and methodology of radiometric dating, often implying in the process that scientists do not arrive at their conclusions honestly. One of the principal practitioners of this approach is Slusher (117), whose “Critique of Radiometric Dating” abounds with such unjustified statements. A few examples will illustrate that the comments by Slusher (117) and other creation “scientists” are based on ignorance of the methods and are unfounded.
Initial 87Sr
There is really no valid way of determining what the initial amounts of Sr87 in rocks were. There is much juggling of numbers and equations to get results in agreement with the U-Th-Pb “clocks.” In all these radioactive clocks, all methods are made to give values that fit the evolutionist’s belief as to the age of the earth and the ages of the geological events. The reason that the various dating methods give similar ages after “analysis” is that they are made to do so. In the case of the initial Sr87/Sr86 ratios, these values can be adjusted so that any age desired is obtainable. (117, p. 40)
Slusher (117) is wrong on all counts.
As discussed above in the section on Rb-Sr dating the simplest form of Rb-Sr dating (i.e., dating by measuring the 87Rb and 87Sr contents in a single sample) can be done only on those samples that are so low in initial 87Sr that the initial Sr correction is negligible. Such samples are rare, and so nearly all modern Rb-Sr dating is done by the isochron method. The beauty of the Rb-Sr isochron method is that knowledge of the initial Sr isotopic composition is not necessary — it is one of the results obtained. Contrary to Slusher’s (117) statement, the amount of initial 87Sr is not needed to solve the Rb-Sr isochron age equation, only the current 87Sr/86Sr ratio, and the initial 87Sr/86Sr ratio is not adjusted for any purpose.
A second advantage of the isochron method is that it contains internal checks on reliability. Look again at the isochron for the meteorite Juvinas (Figure 3). The initial 87Sr/86Sr ratio of 0.69896 was not assumed; it was a result of the isochron analysis. The data are straightforward (albeit technically complex) measurements that fall on a straight line, indicating that the meteorite has obeyed the closed-system requirement. The decay constants used in the calculations were the same as those in use throughout the world in 1975.5 These data were not “made” to result in an old age, as Slusher (117) claims. The age of 4.60 ± 0.07 billion years is a result obtained because Juvinas is genuinely an ancient object.
Initial 40Ar
There is far too much Ar40 in the earth for more than a small fraction of it to have been formed by radioactive decay of K40. This is true even if the earth were really 4.5 billion years old. In the atmosphere of the earth, Ar40 constitutes 99.6% of the total argon. This is around 100 times the amount that would be generated by radioactive decay over the hypothetical 4.5 billion years. Certainly this is not produced by an influx from outer space. Thus it would seem that a large amount of Ar40 was present in the beginning. Since geochronologists assume that errors due to presence of initial Ar40 are small, their results are highly questionable. (117, p.39)
This statement contains several serious errors. First, there is not more 40Ar in the atmosphere than can be accounted for by radioactive decay of 40K over 4.5 billion years. An amount of 40Ar equivalent to all the 40Ar now in the atmosphere could be generated in 4.5 billion years if the Earth contained only 85 ppm potassium. Current estimates of the composition of the Earth indicate that the crust contains about 1.9 percent potassium and the mantle contains between 100 and 400 ppm potassium. The 40Ar content of the atmosphere is well known and is 6.6 × 10¹⁹ grams. The estimated 40Ar content of the crust and mantle combined is about 4 to 19 × 1019 grams (60). Thus, the Earth and the atmosphere now contain about equal amounts of 40Ar, and the total could be generated if the Earth contained only 170 ppm potassium and released half of its 40Ar to the atmosphere. Second, there have been sufficient tests to show that during their formation in the crust, igneous and metamorphic rocks nearly always release their entrapped 40Ar, thus resetting the K-Ar clock. In addition, scientists typically design their experiments so that anomalous results, such as might be caused by the rare case of initial 40Ar, are readily apparent. The study of the Liberian diabase dikes, discussed above, is a good example of this practice.
Isochrons
Several creation “scientists” have attempted to discredit Rb-Sr isochron dating by criticizing the fundamental principles of the method. Three of these criticisms are worth examining because they illustrate how little these creation “scientists” understand about the fundamentals of geochemistry in general and about isochrons in particular.
1. Uniform Initial 87Sr/86Sr Ratio
Now concerning the assumption that the samples had the same initial Sr87/Sr86 ratio, some pertinent remarks may be made. First, if it is assumed that there is a uniform distribution of Sr87 in the rock, then it is assumed that there is also a uniform distribution of Rb87. But, of course, this is not assumed by the geochronologist since there would, by conventional theory, have to be a clustering of his points at one position on a Sr87/Sr86 vs. Rb87/Sr86 graph. (117, p. 42)
There are two serious flaws in Slusher’s (117) argument; first, the Rb-Sr isochron method does not require a uniform distribution of 87Sr. It only requires that the Sr isotopic composition, i.e., the 87Sr/86Sr ratio, be constant in all phases (commonly minerals from the same rock) at the time the rock formed (Figure 2). Even though the various minerals will incorporate different amounts of Sr as they cool and form, the Sr isotopic composition will be the same because natural processes do not significantly fractionate isotopes with so little mass difference as 87Sr and 86Sr. Second, Slusher (117) has confused isotopes and elements. It would be absurd to assume that either the amount of 87Rb or the 87Rb/86Sr ratio is uniform when a rock forms. Rb and Sr are quite different elements and are incorporated into the various minerals in varying proportions according to the composition and structure of the minerals. The Rb-Sr isochron method works precisely because the Rb/Sr ratio, expressed in the isochron diagram as 87Rb/86Sr (Figure 2), varies from mineral to mineral at formation, whereas the Sr isotopic composition (87Sr/86Sr ratio) does not.
2. The 54Fe/86Sr Ratio Versus S8Fe/86Sr Ratio Analogy
Dr. Cook has pointed out that the obtaining of the isochrons is better explained as a natural isotopic variation effect, since similar curves are obtained for plots of Fe54/Sr86 vs Fe58/Sr86 which are known not to be time functions since these ratios have nothing to do with radioactivity because these isotopes are not radioactive. There is no way to correct for this natural isotopic variation since there is no way to determine it. This renders the Rb87-Sr87 series useless as a clock. (117, p. 42)
Slusher (117) is wrong again. He has used an invalid analogy and come to an erroneous conclusion. 54Fe and 58Fe are naturally occurring isotopes of iron whose abundance is 5.8 and 0.3 percent, respectively, of the total iron. All a plot of 54Fe/86Sr ratio versus 58Fe/86Sr ratio demonstrates is that (1) the Fe/Sr ratio is not constant, and (2) the 54Fe content increases with the S8Fe content; both are expectable results. The slope of the line in such a plot is simply the natural abundance 54Fe/58Fe ratio. The same sort of line will be obtained by plotting any pair of naturally occurring isotopes of the same element normalized by any nonradiogenic isotope, including 87Rb/86Sr ratio versus 85Rb/86Sr ratio. Contrary to Slusher’s (117) statement, these plots demonstrate only elemental variations in nature, not isotopic fractionation, and they have nothing to do with the validity of the Rb-Sr isochron.
The Rb-Sr isochron differs from Slusher’s (117) analogy in a very important way; i.e., the 87Sr/86Sr ratio in a system, plotted on the ordinate (Figure 2), can only vary by radioactive decay of 87Rb, plotted on the abscissa, over time. In comparing the Rb-Sr isochron diagram with Cook’s Fe/Sr diagram, Slusher (117) is merely showing that he does not understand either.
3. Isochrons and Mixing Lines
Arndts and Overn (8) and Kramer and others (78) claim that Rb-Sr isochrons are the result of mixing, rather than of decay of 87Rb over long periods:
It is clear that mixing of pre-existent materials will yield a linear array of isotopic ratios. We need not assume that the isotopes, assumed to be daughter isotopes, were in fact produced in the rock by radioactive decay. Thus the assumption of immense ages has not been proven.
The straight lines, which seem to make radiometric dating meaningful, are easily assumed to be the result of simple mixing. (8, p. 6)
These authors note that it is mathematically possible to form a straight line on a Rb-Sr isochron diagram by mixing, in various proportions, two end members of different 87Sr/86Sr and 87Rb/86Sr compositions.
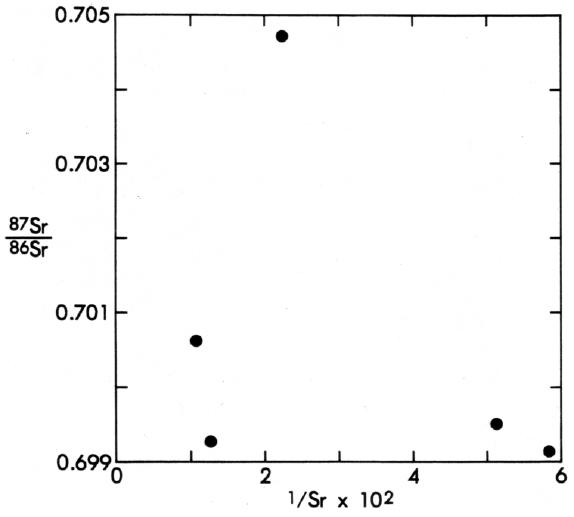
A test sometimes employed to check for mixing is to plot the 87Sr/86Sr ratio against 1/Sr (49). This plot shows whether the 87Sr/86Sr ratio varies systematically with the Sr content of the various samples analyzed, as would be the case if the isochron were due to mixing rather than radioactive to decay over time. Kramer and others (78) have analyzed the data from 18 Rb-Sr isochrons published in the scientific literature by plotting the 87Sr/86Sr ratio versus 1/Sr and calculating the correlation coefficient (C.C.) to test for linear relations:
We found that 8 (44%) had a C.C. in excess of .9; 5 additional (28%) had a C.C. in excess of .8; 1 additional (6%) had a C.C. in excess of .7; 2 additional (11%) had a C.C. in excess of .6; and 2 (11%) had a C.C. less than .5 …
This preliminary study of the recent evolutionary literature would suggest that there are many published Rb-Sr isochrons with allegedly measured ages of hundreds of millions of years which easily meet the criteria for mixing, and are therefore more cogently indicative of recent origin. (78, p.2)
Whereas a linear plot on a diagram of 87Sr/86Sr versus 1/Sr is a necessary consequence of mixing, it is not a sufficient test for mixing. Kramer and others ( 78) and Arndts and Overn (8) have come to an incorrect conclusion because they have ignored several important facts about the geochemistry of Rb-Sr systems and the systematics of isochrons.
First, the chemical properties of rubidium and strontium are quite different, and thus their behavior in minerals is dissimilar. Both are trace elements and rarely form minerals of their own. Rubidium is an alkali metal, with a valence of +1 and an ionic radius of 1.48 Å. It is chemically similar to potassium and tends to substitute for that element in minerals in which potassium is a major constituent, such as potassium feldspar and the micas muscovite and biotite. Strontium, on the other hand, is an alkaline-earth element, with a valence of +2 and an ionic radius of 1.13 Å. It commonly substitutes for calcium in calcium minerals, such as the plagioclase feldspars. The chemical properties of rubidium and strontium are so dissimilar that minerals which readily accept rubidium into their crystal structure tend to exclude strontium and vice versa. Thus, rubidium and strontium in minerals tend to be inversely correlated; minerals high in rubidium are generally low in strontium and vice versa. Because minerals high in rubidium will also have higher 87Sr/86Sr ratios within a given period than those low in rubidium (see Figure 2), the 87Sr/86S r ratio commonly is inversely correlated with the Sr content. Thus, mineral and rock isochron data will commonly show a quasi-linear relation on a diagram of 87Sr/86Sr versus 1/Sr, with the 87Sr/86Sr ratio increasing with increasing 1/Sr. This relation, however, is a natural consequence of the chemical behavior of rubidium and strontium in minerals and of the decay of 87Rb to 87Sr over time, and has nothing to do with mixing.
Second, mixing is a mechanical process that is physically possible only in those rock systems where two or more components with different chemical and isotopic compositions are available for mixing. Examples include the mingling of waters from two streams, the mixing of sediment from two different source rocks, and the contamination of lava from the mantle by interactions with the crustal rocks through which it travels to the surface. Mixing in such systems has been found (49, 70), but the Rb-Sr method is rarely used on these systems. The Rb-Sr isochron method is most commonly used on igneous rocks, which form by cooling from a liquid. Mineral composition and the sequence of mineral formation are governed by chemical laws and do not involve mixing. In addition, a rock melt does not contain isotopic end members that can be mechanically mixed in different proportions into the various minerals as they form, nor could such end members be preserved if they were injected into a melt.
Third, how could an end member with a high 87Sr/86Sr ratio exist if this ratio ultimately were not due to the decay of 87Rb over time? Even if isochrons were the result of mixing — which they are not — the existence of a high 87Sr/86Sr ratio end member would indicate the passage of billions of years.
Fourth, if isochrons were the result of mixing, approximately half of them should have negative slopes. In fact, negative slopes are exceedingly rare and are confined to those types of systems, mentioned above, in which mechanical mixing is possible and evident.
Finally, there are numerous isochrons that do not show a positive correlation on a diagram of the 87Sr/86Sr versus 1/Sr. An example is the meteorite Juvinas (Figure 3). A plot of the 87Sr/86Sr ratio versus 1/Sr for this meteorite (Figure 7) shows clearly that there is no linear relation. Thus, even using the criteria developed by Arndts and Overn (8) and Kramer and others (78), the 4.6-billion-year isochron for Juvinas must be accepted as representing a valid crystallization age.
|
Therefore, arguments advance by Arndts and Overn (8) and by Kramer and others (78) are based on premises that are geochemically and logically unsound, and their conclusion that isochrons are due to mixing rather than to decay of 87Rb over geologic time is incorrect.
Instrumentation
The radioactivity of carbon-14 is very weak and even with all its dubious assumptions the method is not applicable to samples that supposedly go back 10,000 to 15,000 years. In those intervals of time the radioactivity from the carbon-14 would become so weak that it could not be measured with the best of instruments. Claims have been made that dating can be done back to from 40 to 70 thousand years, but it seems highly improbable that instruments could measure activity of the small amounts of C14 that would be present in a sample more than 15,000 years old. (117, p. 45)
This statement was as untrue when it was first written in 1973 (117, 1973 ed., p. 35) as it is today. Modern counting instruments, available for more than two decades, are capable of counting the 14C activity in a sample as old as 35,000 years in an ordinary laboratory, and as old as 50,000 years in laboratories constructed with special shielding against cosmic radiation. New techniques using accelerators and highly sensitive mass spectrometers, now in the experimental stage, have pushed these limits back to 70,000 or 80,000 years and may extend them beyond 100,000 years in the near future.
CONSTANCY OF RADIOACTIVE DECAY
Creation “scientists” commonly claim that the process of radioactive decay is not constant. Before discussing some of their claims, it is worth discussing briefly the types of radioactive decay and the evidence that decay is constant over the range of conditions undergone by the rocks available to scientists.
Most radioactive decay involves the ejection of one or more sub-atomic particles from the nucleus. Alpha decay occurs when an alpha particle (a helium nucleus), consisting of two protons and two neutrons, is ejected from the nucleus of the parent isotope. Beta decay involves the ejection of a beta particle (an electron) from the nucleus. Gamma rays (very small bundles of energy) are the device by which an atom rids itself of excess energy. Because these types of radioactive decay occur spontaneously in the nucleus of an atom, the decay rates are essentially unaffected by physical or chemical conditions. The reasons for this are that nuclear forces act over distances much smaller than the distances between nuclei, and that the amounts of energy involved in nuclear transformations are much greater than those involved in normal chemical reactions or normal physical conditions. Putting it another way, the “glue” holding the nucleus together is extremely effective, and the nucleus is well insulated from the external world by the electron cloud surrounding every atom. This combination of the strength of nuclear binding and the insulation of the nucleus is the reason why scientists must use powerful accelerators or atomic reactors to penetrate and induce changes in the nuclei of atoms.
A great many experiments have been done in attempts to change radioactive decay rates, but these experiments have invariably failed to produce any significant changes. It has been found, for example, that decay constants are the same at a temperature of 2000°C or at a temperature of -186°C and are the same in a vacuum or under a pressure of several thousand atmospheres. Measurements of decay rates under differing gravitational and magnetic fields also have yielded negative results. Although changes in alpha and beta decay rates are theoretically possible, theory also predicts that such changes would be very small (42) and thus would not affect dating methods. Under certain environmental conditions, the decay characteristics of 14C, 60Co, and 137Ce, all of which decay by beta emission, do deviate slightly from the ideal random distribution predicted by current theory (5, 6), but changes in the decay constants have not been detected.
There is a fourth type of decay that can be affected by physical and chemical conditions, though only very slightly. This type of decay is electron capture (e.c. or K-capture), in which an orbital electron is captured by the nucleus and a proton is converted into a neutron. Because this type of decay involves a particle outside the nucleus, the decay rate may be affected by variations in the electron density near the nucleus of the atom. For example, the decay constant of 7Be in different beryllium chemical compounds varies by as much as 0.18 percent (42, 64,). The only isotope of geologic interest that undergoes e.c. decay is 40K, which is the parent isotope in the K-Ar method. Measurements of the decay rate of 40K in different substances under various conditions indicate that variations in the chemical and physical environment have no detectable effect on its e.c. decay constant.
Another type of decay for which small changes in rate have been observed is internal conversion (IC). During i nternal conversion, however, an atom’s nucleus goes from one energy state to a lower energy state; it does not involve any elemental transmutation and is, therefore, of little relevance to radiometric dating methods.
Slusher (115, p. 283) states that “there is excellent laboratory evidence that external influences can change the decay rates,” but the examples he cites are either IC or e.c. decays with exceedingly small changes in rates. For example, in the first (1973) edition of his monograph on radiometric dating, Slusher (117) claims that the decay rate of 57Fe has been changed by as much as 3 percent by electric fields; however this is an IC decay, and 57Fe remains Fe. Note, however, that even a 3 percent change in the decay constants of our radiometric clocks would still leave us with the inescapable conclusion that the Earth is more than 4 billion years old. DeYoung (37) lists 20 isotopes whose decay rates have been changed by environmental conditions, alluding to the possible significance of these changes to geochronology, but the only significant changes are for isotopes that “decay” by internal conversion. These changes are irrelevant to radiometric dating methods.
Morris (92) claims that free neutrons might change decay rates, but his arguments show that he does not understand either neutron reactions or radioactive decay. Neutron reactions do not change decay rates but, instead, transmute one nuclide into another. The result of the reaction depends on the properties of the target isotope and on the energy of the penetrating neutron. There are no neutron reactions that produce the same result as either beta or alpha decay. An (n,p) (neutron in, proton out) reaction produces the same change in the nucleus of an atom as e.c. decay, but there are simply not enough free neutrons in nature to affect any of the isotopes used in radiometric dating. If enough free neutrons did exist, they would produce other measurable nuclear transformations in common elements that would clearly indicate the occurrence of such a process. No such transformations have been found, and so Morris’ claims are disproved.
Morris (92) also suggests that neutrinos might change decay rates, citing a column by Jueneman (72) in Industrial Research. The subtitle of Jueneman’s columns, which appear regularly, is, appropriately, “Scientific Speculation.” He speculates that neutrinos released in a supernova explosion might have “re-set” all the radiometric clocks. Jueneman describes a highly speculative hypothesis that would account for radioactive decay by interaction with neutrinos rather than by spontaneous decay, and he notes that an event that temporarily increased the neutrino flux might “reset” the clocks. Jueneman, however, does not propose that decay rates would be changed, nor does he state how the clocks would be reset; in addition, there is no evidence to support his speculation. Neutrinos are particles that are emitted during beta decay. They have no charge and very small or possibly no rest mass. Their existence was proposed by Wolfgang Pauli in 1931 to explain why beta particles are given off with a wide range of energies from any one isotope, rather than with a constant energy; the “missing” energy is carried off by the neutrino. Because they have no charge and little or no mass, neutrinos do not interact much with matter — most pass unimpeded right through the Earth — and they can be detected experimentally only with great difficulty. The chance that neutrinos could have any effect on decay rates or produce nuclear transmutations in sufficient amounts to have any significant effect on our radiometric clocks is exceedingly small.
Slusher (117) and Rybka (110) also propose that neutrinos can change decay rates, citing an hypothesis by Dudley (40) that decay is triggered by neutrinos in a “ neutrino sea” and that changes in the neutrino flux might affect decay rates. This argument has been refuted by Brush (20), who points out that Dudley’s hypothesis not only requires rejection of both relativity and quantum mechanics, two of the most spectacularly successful theories in modern science, but is disproved by recent experiments. Dudley himself rejects the conclusions drawn from his hypothesis by Slusher (117) and Rybka (110), noting that the observed changes in decay rates are insufficient to change the age of the Earth by more than a few percent (Dudley, personal communication, 1981, quoted in 20, p. 51). Thus, even if Slusher and Rybka were correct — which they are not — the measured age of the Earth would still exceed 4 billion years.
Slusher (115, 117) and Rybka (110) also claim that the evidence from pleochroic halos6 indicates that decay rates have not been constant over time:
… evolutionist geologists have long ignored the evidence of variability in the radii of pleochroic halos, which shows that the decay rates are not constant and would, thus, deny that some radioactive elements such as uranium could be clocks. (115, p. 283)
In a review of the subject, however, Gentry (52) concludes that the data from pleochroic halo studies are inconclusive on this point — the uncertainties in the measurements and other factors are too great.
Rybka (110) claims that experimental evidence suggests that decay rates have changed over time:
Two cases where it appears that the half life is increasing with time are as follows. Glasstone (1950) has the half life for Protactinium 231 as 3.2 × 10⁴ years while Kaplan (1962) has the half life as 3.43 × 10⁴ years. For the half life of Radium 223, Glasstone has 11.2 days while Kaplan has 11.68 days. (110, p. ii)
Rybka’s (110) analysis of the situation, however, is wrong. He has failed to consider all of the data.
The various values for the half lives of 223Ra and 231Pa reported in the literature since 1918 are given in Table 3. It is clear that there is no increase in the values as a function of time. The differences in the reported half lives are a consequence of improved methods and instruments, and the care with which the individual measurements were made. For example, Kirby and others (74) argue convincingly that the measurements of the half life of 223Ra reported from 1953 to 1959 (Table 3) suffered from inadequate experimental methods and are not definitive. Kirby and his colleagues carefully measured this half life by two different methods and obtained values of 11.4347 ± 0.0011 days and 11.4267 ± 0.0062 days. The weighted mean of these two measurements is 11.4346 ± 0.0011 days, which currently is the best value for the half life of 223Ra. I should also mention that the two references cited by Rybka are textbooks, not the publications in which the original data were reported; the dates of publication of these texts, therefore, do not reflect the years in which the measurements were made or reported.
| Nuclide | Year Reported | Half-Life |
|---|---|---|
| 223Ra |
1918 | 11.2 days |
| 1953 | 11.1 days | |
| 1954 | 11.685 days | |
| 1959 | 11.22 days | |
| 1959 | 11.41 days | |
| 1965 | 11.4346 days | |
| 231Pa |
||
| 1930 | 3.2 × 10⁴ years | |
| 1932 | 3.2 × 10⁴ years | |
| 1949 | 3.43 × 10⁴ years | |
| 1968 | 3.234 × 10⁴ years | |
| 1969 | 3.276 × 10⁴ years | |
| 1977 | 3.276 × 10⁴ years |
Rybka (110) also explores the consequences of a hypothetical change over time of the decay constant, but his results are due solely to his arbitrary changes in the decay formula — changes for which there is neither a theoretical basis nor a shred of physical evidence.
In summary, the attempts by creation “scientists” to attack the reliability of radiometric dating by invoking changes in decay rates are meritless. There have been no changes observed in the decay constants of those isotopes used for dating, and the changes induced in the decay rates of other radioactive isotopes are negligible. These observations are consistent with theory, which predicts that such changes should be very small. Any inaccuracies in radiometric dating due to changes in decay rates can amount to, at most, a few percent.
ACCURACY OF CONSTANTS
Several creationist authors have criticized the reliability of radiometric dating by claiming that some of the decay constants, particularly those for 40K, are not well known (28, 29, 92, 117). A common assertion is that these constants are “juggled” to bring results into agreement; for example:
The so-called “branching ratio”, which determines the amount of the decay product that becomes argon (instead of calcium) is unknown by a factor of up to 50 percent. Since the decay rate is also unsettled, values of these constants are chosen which bring potassium dates into as close correlation with uranium dates as possible. (92, p. 145)
There seems to be some difficulty in determining the decay constants for the K40-Ar40 system. Geochronologists use the branching ratio as a semi-empirical, adjustable constant which they manipulate instead of using an accurate half-life for K40. (117, p. 40)
These statements would have been true in the 1940s and early 1950s, when the K-Ar method was first being tested, but they were not true when Morris (92) and Slusher (117) wrote them. By the mid- to late 1950s the decay constants and branching ratio of 40K were known to within a few percent from direct laboratory counting experiments (2). Today, all the constants for the isotopes used in radiometric dating are known to better than 1 percent. Morris (92) and Slusher (117) have selected obsolete information out of old literature and tried to represent it as the current state of knowledge.
In spite of the claims by Cook (28, 29), Morris (92), Slusher (115, 117), DeYoung (37) and Rybka (110), neither decay rates nor abundance constants are a significant source of error in any of the principal radiometric dating methods. The reader can easily satisfy himself on this point by reading the report by Steiger and Jaeger (124) and the references cited therein.
NEUTRON REACTIONS AND Pb-ISOTOPIC RATIOS
Neutron reaction corrections in the U-Th-Pb series reduce “ages” of billions of years to a few thousand years because most of the Pb can be attributed to neutron reactions rather than to radioactive decay. (117, p. 54)
Statements similar to this one by Slusher (117) are also made by Morris (92). These statements spring from an argument developed by Cook (28) that involves the use of incorrect assumptions and nonexistent data.
Cook’s (28) argument, repeated in some detail by Morris (92) and Slusher (117), is based on U and Pb isotopic measurements made in the late 1930s and early 1950s on uranium ore samples from Shinkolobwe, Katanga and Martin Lake, Canada. Here, I use the Katanga example to show the fatal errors in Cook’s (28) proposition.
| 206Pb/238U age = 616 million years | |
| 206Pb/207Pb age = 610 million years | |
| Element (weight percent in ore) |
Pb isotopes (percent of total Pb) |
|---|---|
| U = 74.9 | 204Pb = ----- |
| Pb = 6.7 | 206Pb = 94.25 |
| Th = --- | 207Pb = 5.70 |
| 208Pb = 0.042 |
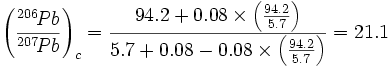
In the late 1930s, Nier (100) published Pb isotopic analyses on 21 samples of uranium ore from 14 localities in Africa, Europe, India, and North America and calculated simple U-Pb ages for these samples. Some of these data were later compiled in the book by Faul (46) that Cook (28) cites as the source of his data. Table 4 lists the data for one typical sample. Cook notes the apparent absence of thorium and 204Pb, and the presence of 208Pb. He reasons that the 208Pb could not have come from the decay of 232Th because thorium is absent, and could not be common lead because 204Pb, which is present in all common lead, is absent. He reasons that the 208Pb in these samples could only have originated by neutron reactions with 207Pb and that 207Pb, therefore, would also be created from Pb-206 by similar reactions:
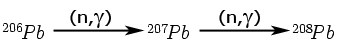
|
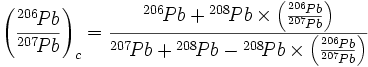
Cook (28) then proposes that these effects require corrections to the measured lead isotopic ratios as follows: (1) the 206Pb lost by conve rsion to 207Pb must be added back to the 206Pb; (2) the 207Pb lost by conversion to 208Pb must be added back to the 207Pb; and (3) the 207Pb gained by conversion from 206Pb must be subtracted from the 207Pb. He presents an equation for making these corrections:
|
based on the assumption that the neutron-capture cross sections7 for 206Pb and 207Pb are equal, an assumption that Cook (28) calls “reasonable.” Cook then substitutes the average values (which differ slightly from the values listed in Table 4) for the Katanga analyses into his equation and calculates a corrected ratio8:
|
This calculation is repeated by both Morris (92) and Slusher (117). Cook (28), Morris (92), and Slusher (117) all note that this ratio is close to the present day production ratio of 206Pb and 207Pb from 238U and 235U, respectively, and conclude, therefore, that the Katanga ores are very young, not old. For example, Slusher (117) states:
This corrected ratio says the corrected age should be practically zero since Pb206/Pb207 = 21.5 for modern radiogenic lead. (117, p. 36)
Although Cook’s (28) logic may, superficially, seem reasonable and straightforward, it suffers from several serious fundamental flaws. First, 204Pb is not absent in the Katanga samples; it simply was not measured! In his report, Nier (100) states:
Actually, in 20 of the 21 samples investigated the amount of common lead is so small that one need not take account of the variations in its composition. In a number of samples where the abundance of 204Pb was very low no attempt was made to measure the amount of it as the determination would be of no particular value. (100, p. 156)
Apparently, neither Cook (28), Morris (92), nor Slusher (117) bothered to read Nier’s (100) complete report and erroneously interpreted the dash for 204Pb in Faul’s (46) tabulation as “zero,” when, in fact, it means “not measured.”
Second, the neutron-capture cross sections for 206Pb and 207Pb are not equal, as Cook (28) assumes, but differ by a factor of 24 (0.03 barns for 206Pb, 0.72 barns for 207Pb‡). This discrepancy has a significant effect on the results of Cook’s (28) calculation. Table 5 compares the results of the three methods of age calculation — the correct method, Cook ’s (28) method, and Cook’s method with the correct nuclear cross sections — using the currently accepted best values for the uranium decay rate and abundance constants. The correct radiometric age is, of course, the scientific value of 622 million years. When Cook’s (28) calculation is done with appropriate allowance for the unequal neutron-capture cross sections of 206Pb and 207Pb, the resulting calculated age is actually older than the scientific value, so even if such neutron reactions had occurred, the effect would be the opposite of that claimed by Cook (28). Note also that even Cook’s (28) incorrect calculation results in an age of 70 million years, not “practically zero” as asserted by Slusher (117).
Method |
206Pb/207Pb |
Age (million years) |
|---|---|---|
| Scientific | 16.53 | 622 |
| Cook (28) | 21.1 | 70 |
| Cook’s (28) calculation done correctly† |
16.38 | 644 |
The third problem with Cook’s proposition is that there are far too few free neutrons available in nature, even in uranium ores, to cause significant effects. This fact is readily acknowledged by Cook:
In spite of evidence that the neutron flux is only a millionth as large as it should be to account for appreciable (n, ) effects, there are several well documented examples that seem to demonstrate the reality of this scheme. (28, p. 54)
The examples are, of course, those from Katanga and Martin Lake.
Thus Cook’s (28) proposition and calculations, enthusiastically endorsed by Morris (92) and Slusher (117), are based on data that do not exist and are, in addition, fatally flawed by demonstrably false assumptions.
1 An isolated system is one in which neither matter nor energy enters or leaves. A closed system is one in which only matter neither enters nor leaves. A system that is not closed is an open system. A “system” may be of any size, including very small (like a mineral grain) or very large (like the entire universe). For radiometric dating the system, usually a rock or some specific mineral grains, need only be closed to the parent and daughter isotopes.
2 Approximately one percent of the Earth’s atmosphere is argon, of which 99.6 percent is 40Ar.
3 These paths will be at an angle of 45° if the scales on the abscissa and ordinate are the same.
4 The 40Ar/39Ar technique is an analytical variation of K-Ar dating. The validity of ages obtained by this technique can be verified from the data alone in a manner analogous to the Rb-Sr isochron method discussed above. For more information on 40Ar/39Ar dating, see Dalrymple (32).
5 Improved constants were adopted worldwide in 1976 (124).
6 Pleochroic halos are rings of discolored areas around radioactive inclusions in some minerals. The discoloration is caused by radiation damage to the crystals by subatomic particles. The radii of these rings are proportional to the energies of the particles.
7 A nuclear reaction cross section, expressed in units of area (barns), is simply a measurement of the probability that the particle in question will penetrate the nucleus of the target isotope and cause the reaction in question.
8 The values and equation actually give a result of 21.3. Cook published a result of 21.1. I have used Cook’s result for consistency.
‡ Note by Jon Fleming, 2005: Dalrymple does not provide a reference for his cross section values. They are not significantly different from modern values, such as the 26.6±1.2 mb for 206Pb and 610±30 mb for 207Pb reported in J. C. Blackmon, S. Raman, J. K. Dickens, R. M. Lindstrom, R. L. Paul, J. E. Lynn, “Thermal-neutron capture by 208Pb”, Physical Review C v65 #4 045801 (2002). Abstract (including the quoted numbers) at http://link.aps.org/abstract/PRC/v65/e045801, accessed December 6, 2005.
† Note by Jon Fleming, 2005: Dalrymple does not present the details of his derivation. See “Addendum: Derivation of the Neutron Reaction Correction Equation” for the derivation of the equation to which Dalrymple refers.